
April 3rd, 2026
Personal Finance
The monthly income that a family needs to be able to afford a typical rental home differs dramatically across the country. Our newest map breaks down the most (and least) expensive places to live

April 3rd, 2026
Personal Finance
social-issues
Women make a lot less money than men, but did you know that going to college might actually make the gender pay gap worse? Our new visualization breaks down the schools with the biggest disparities.
April 3rd, 2026
Personal Finance
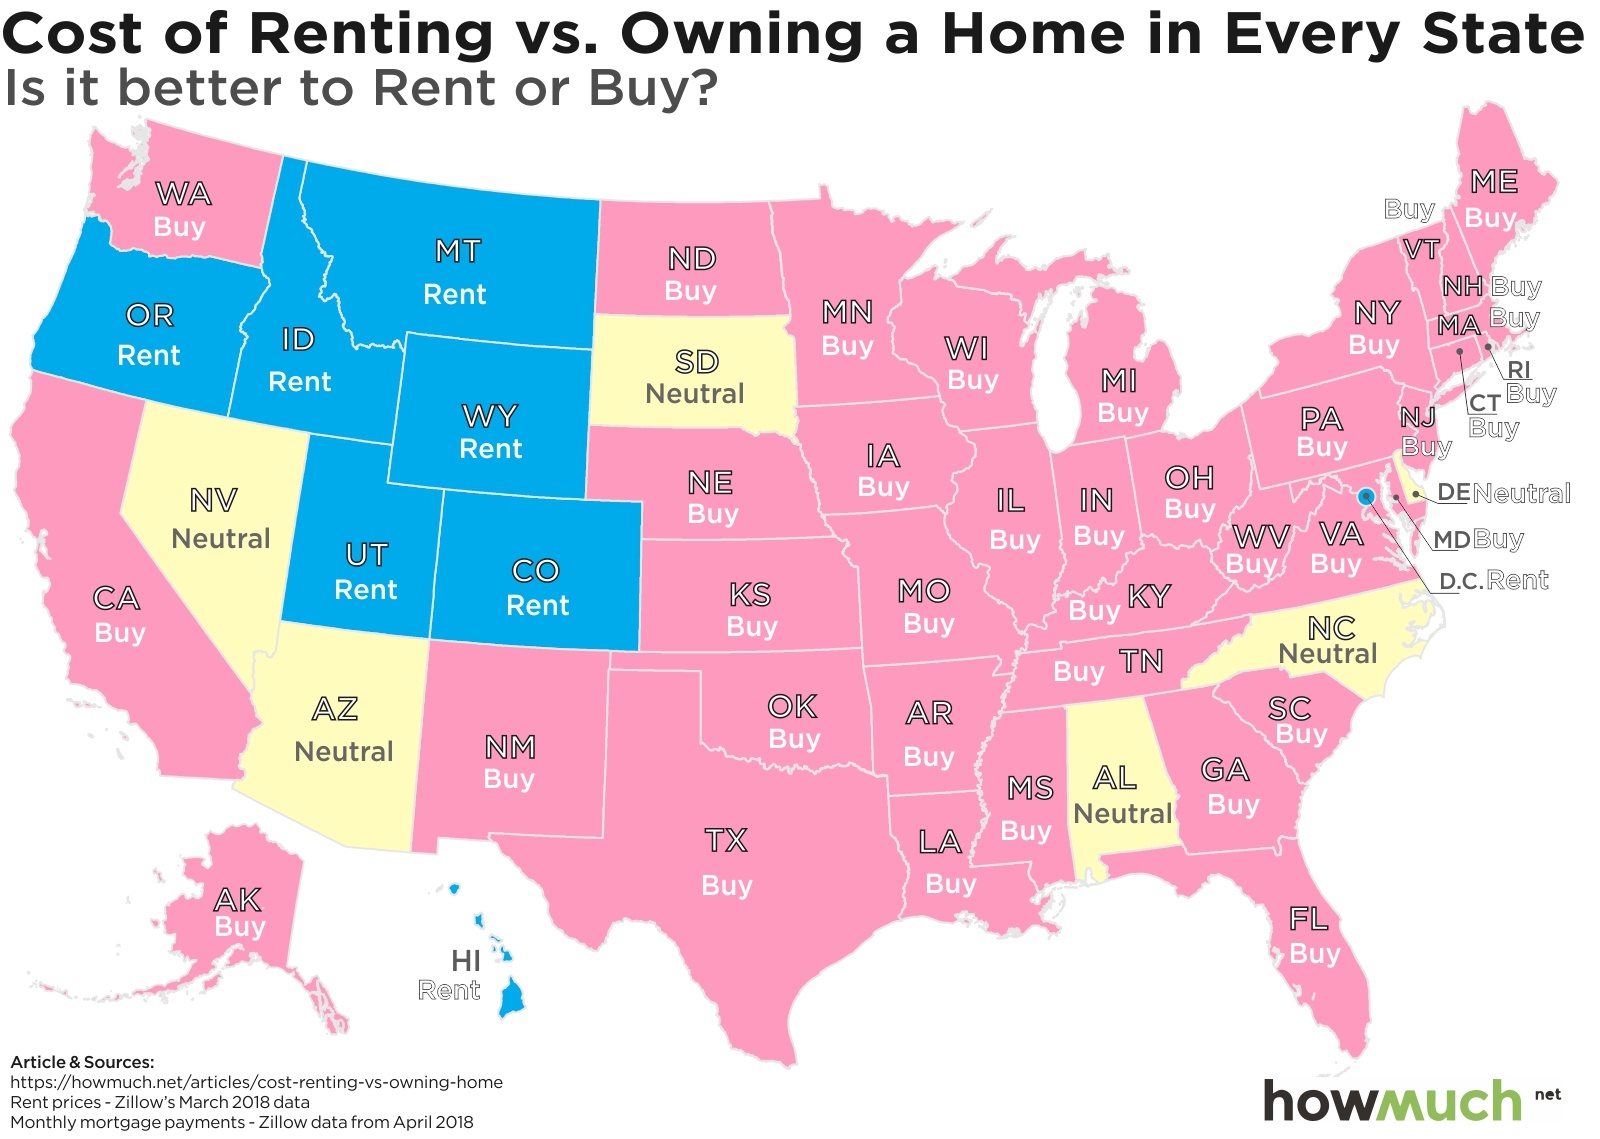
Homeowners build equity over the years, but did you know that they also save money every month compared to renters? Our new map and visualization highlight the states where it makes the most financial sense to buy a home.

April 3rd, 2026
Personal Finance
Real Estate
It’s not just Silicon Valley and New York that have a housing crisis. Our new maps demonstrate which metro areas across the country have the worst problems with providing affordable living spaces.

April 3rd, 2026
Personal Finance
Car insurance is a smart way to protect yourself, but do you know how much it costs? Our new visualization highlights the differences between minimum and full coverage for every state in the country.
April 3rd, 2026
Personal Finance
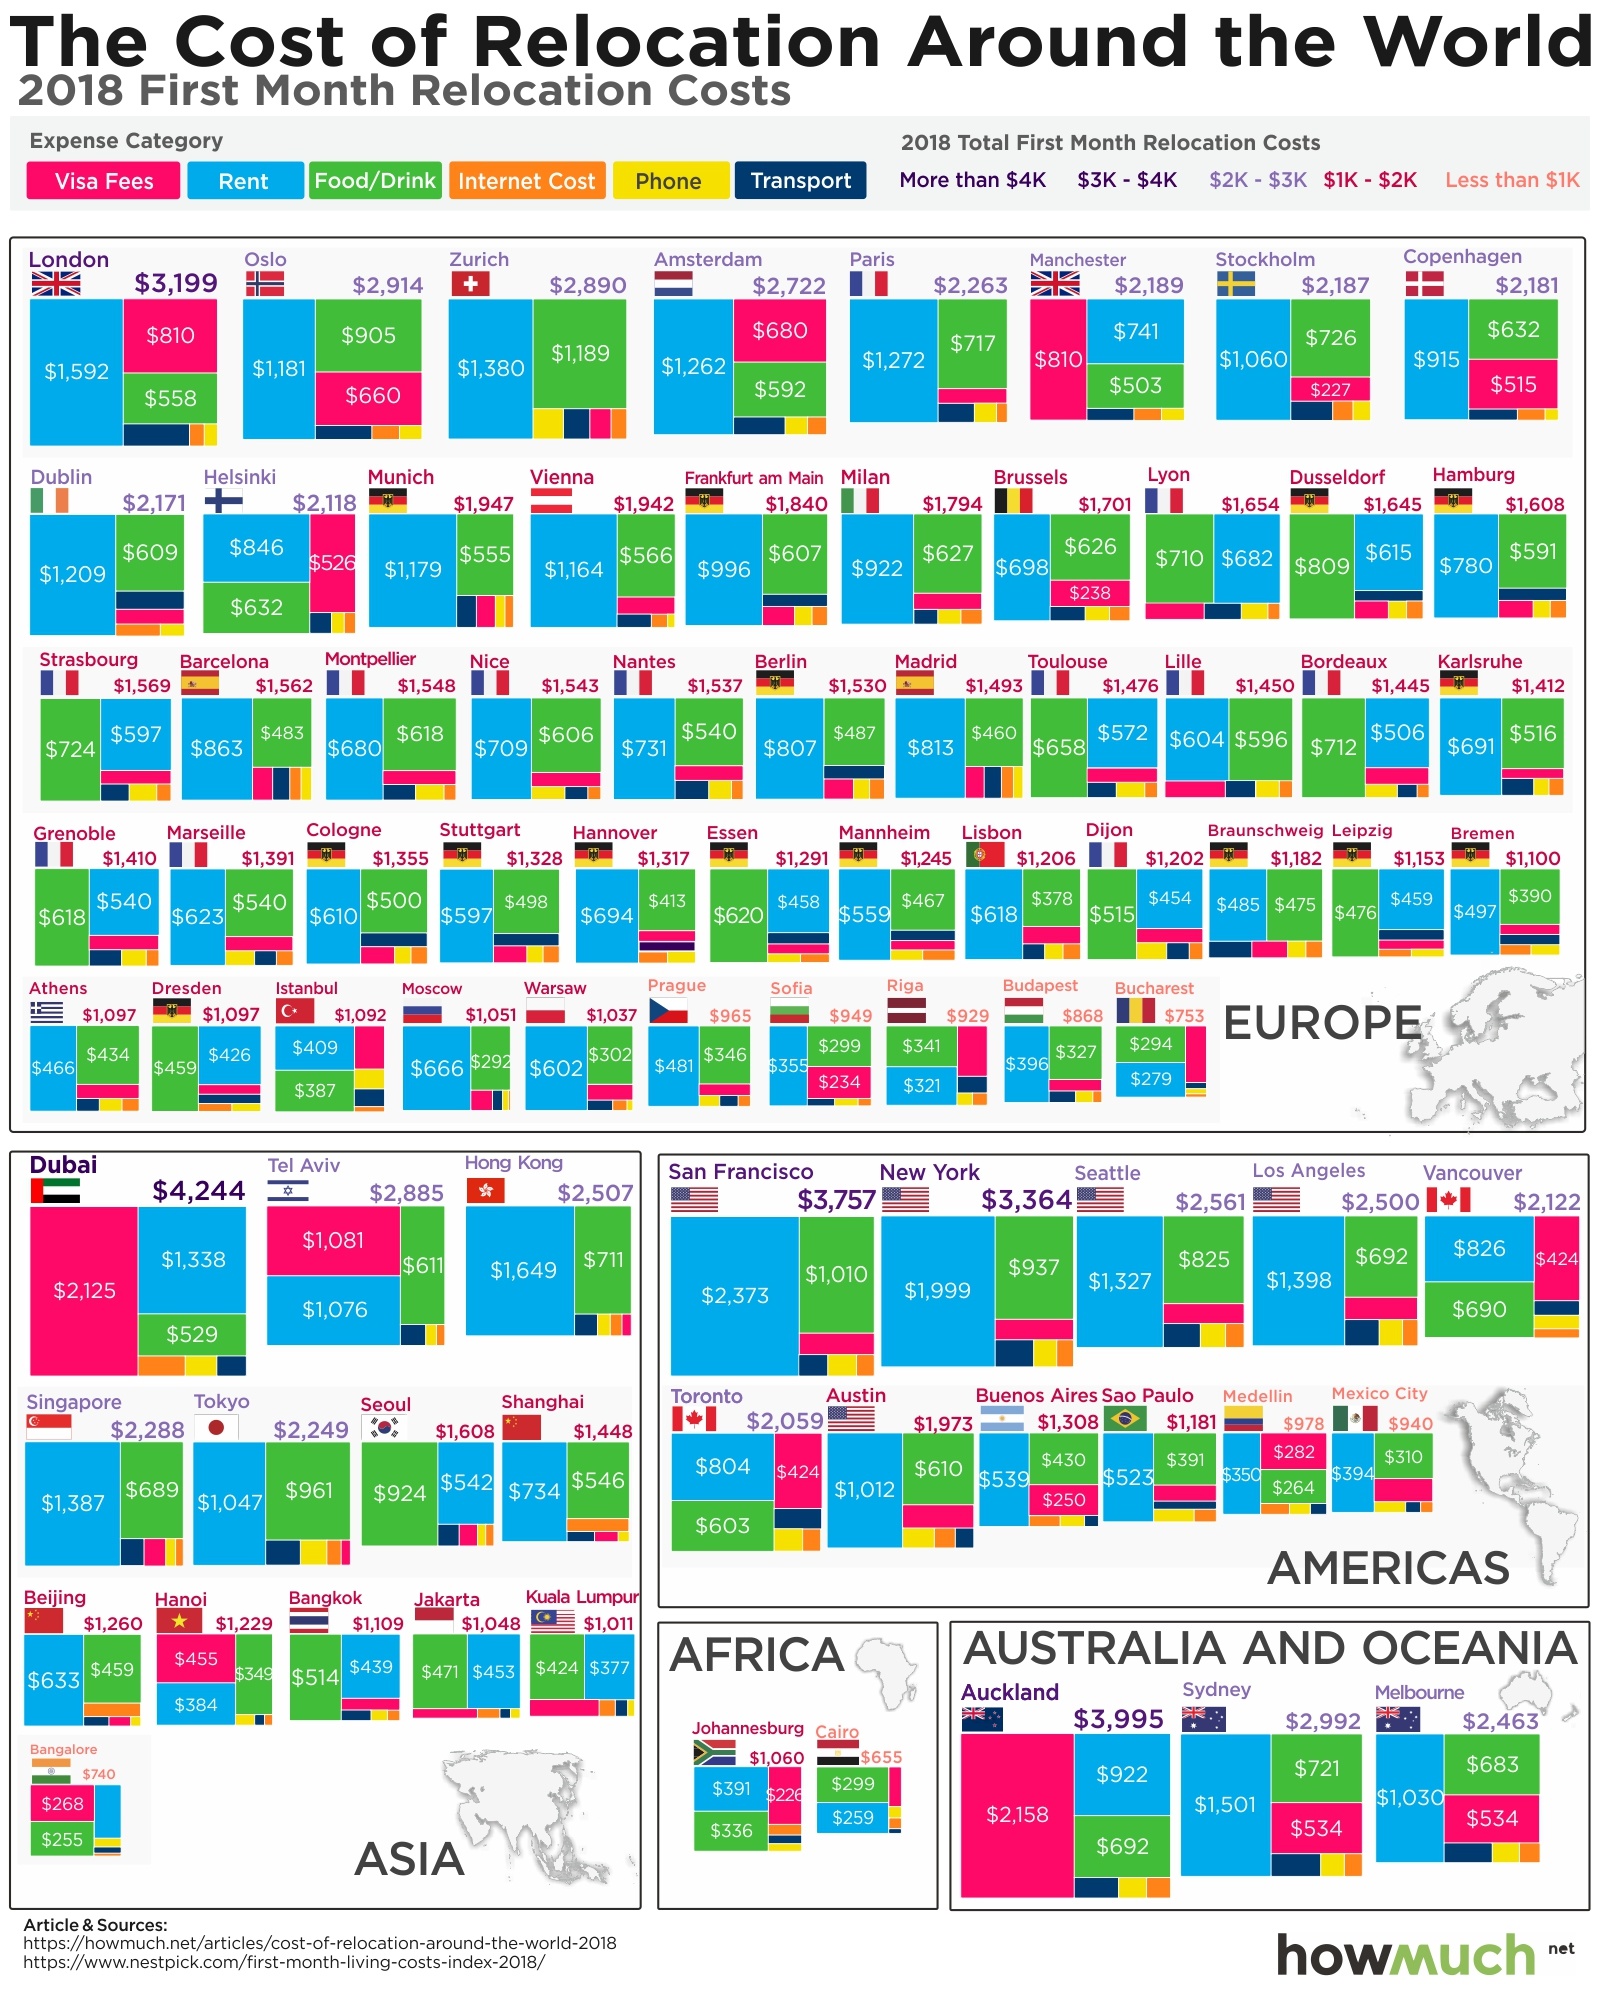
One way to accelerate your career is to move to a city with a better economy and more opportunities, but can you afford to relocate? Our visualization breaks down the costs for 80 large cities around the world.

April 3rd, 2026
Personal Finance
Most people rely on Medicare for health insurance after they retire, but did you know that it won’t cover the full cost of coverage? Our new map breaks down the biggest gaps around the country

April 3rd, 2026
Personal Finance
Owning an iPhone X is a status symbol of wealth and luxury. Our latest visualization breaks down how long people must work around the world to afford one of the most expensive smartphones on the market today.
April 3rd, 2026
Personal Finance
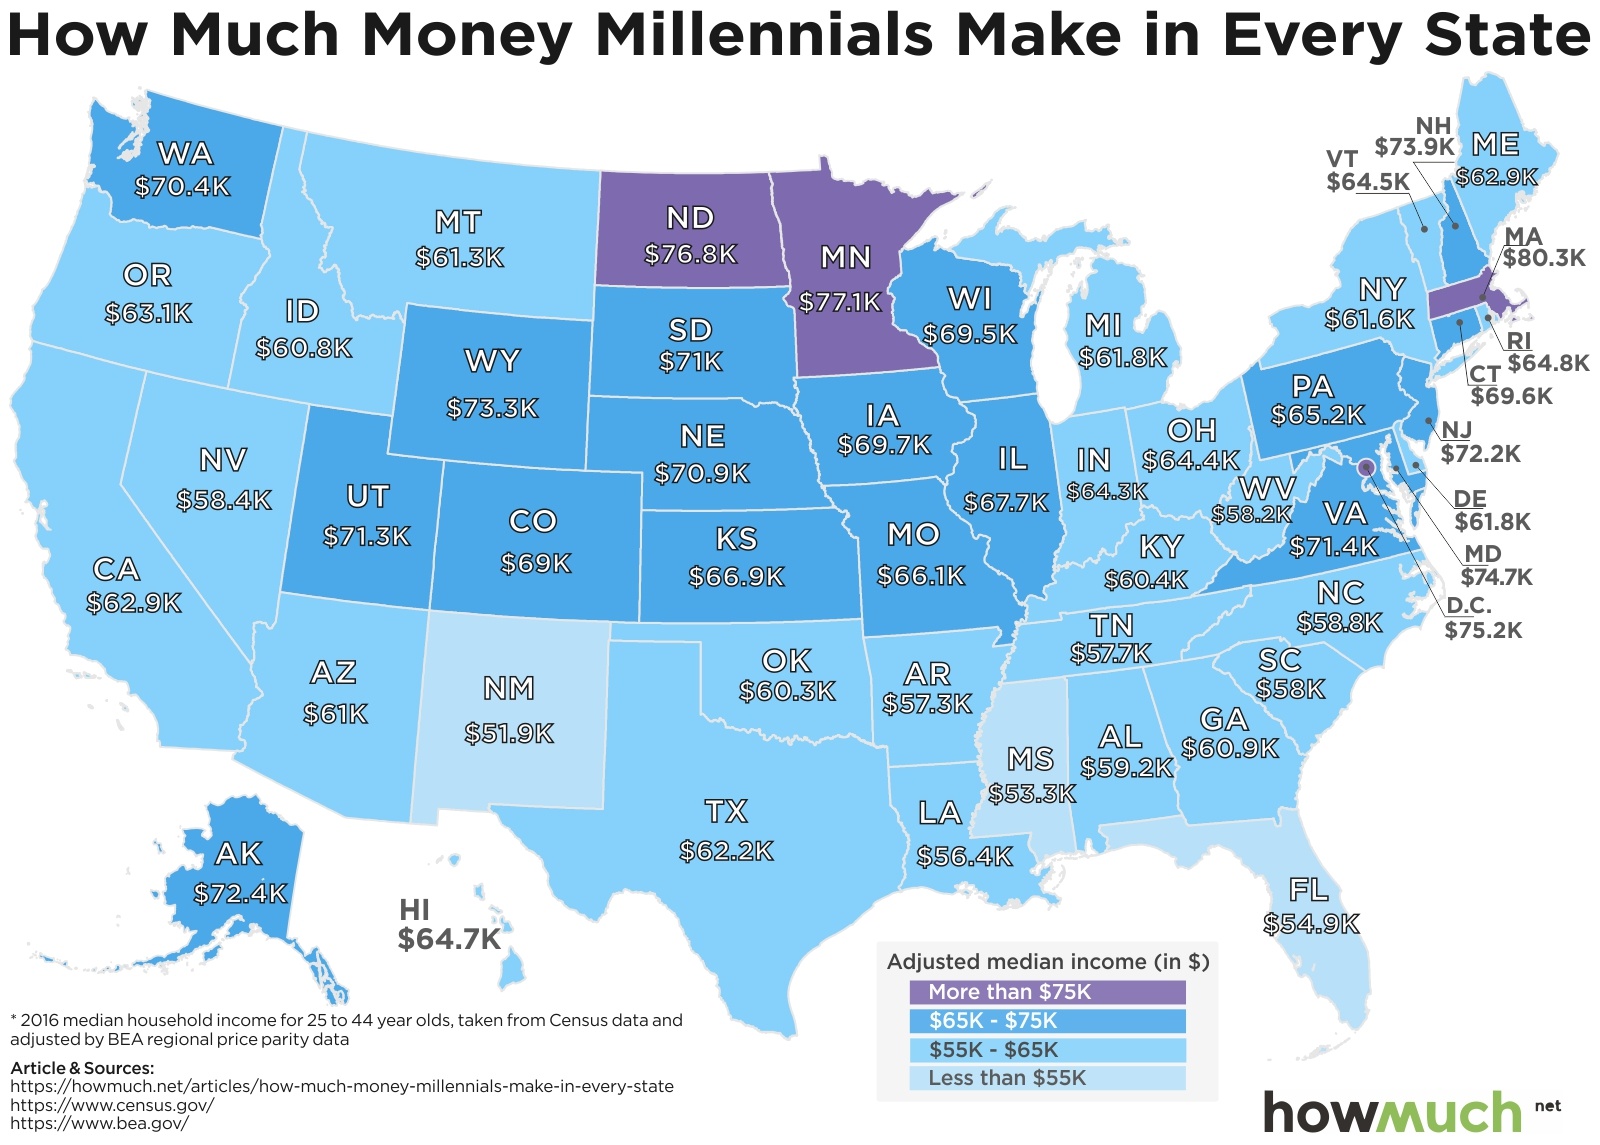
The U.S. economy is humming along, but how are millennials performing in the labor market? Our new map demonstrates how geography plays in role in determining how much young people make in their careers.

April 3rd, 2026
Personal Finance
The cost of electricity is a fixed expense in most people’s budgets, but exactly how much depends on location. Our new visualizations break down the electric utility market in two easy-to-understand maps.