President Trump recently ordered the Energy Department to bail out several unprofitable power plants around the country. There’s no doubt Trump is a big supporter of the coal industry, but it made us think about how the government interferes with energy markets. After all, electric companies are a regulated public utility and they’re subject to additional scrutiny when it comes to setting prices. We wanted to better understand how this impacts the economy, so we created two maps showing residential and commercial electricity prices.
Our data comes from the U.S. Energy Information Administration. We created two heat maps, one for residential electricity (what you pay out-of-pocket at your house) and one for commercial electricity (what businesses pay). Energy utilities can charge different rates depending on the nature of their customers because some companies consume massive amounts of electricity. We turned these numbers into a heat map by state, where the shade corresponds to the price in cents per kilowatt hour (cents/kWh). The result is two snapshots of the American energy economy in easy-to-understand maps.
Top 5 States with the Most Expensive Residential Electricity Rates (cents/kWh)
1. Hawaii: 31.57
2. Massachusetts: 21.64
3. Alaska: 21.43
4. Rhode Island: 21.42
5. Connecticut: 20.77
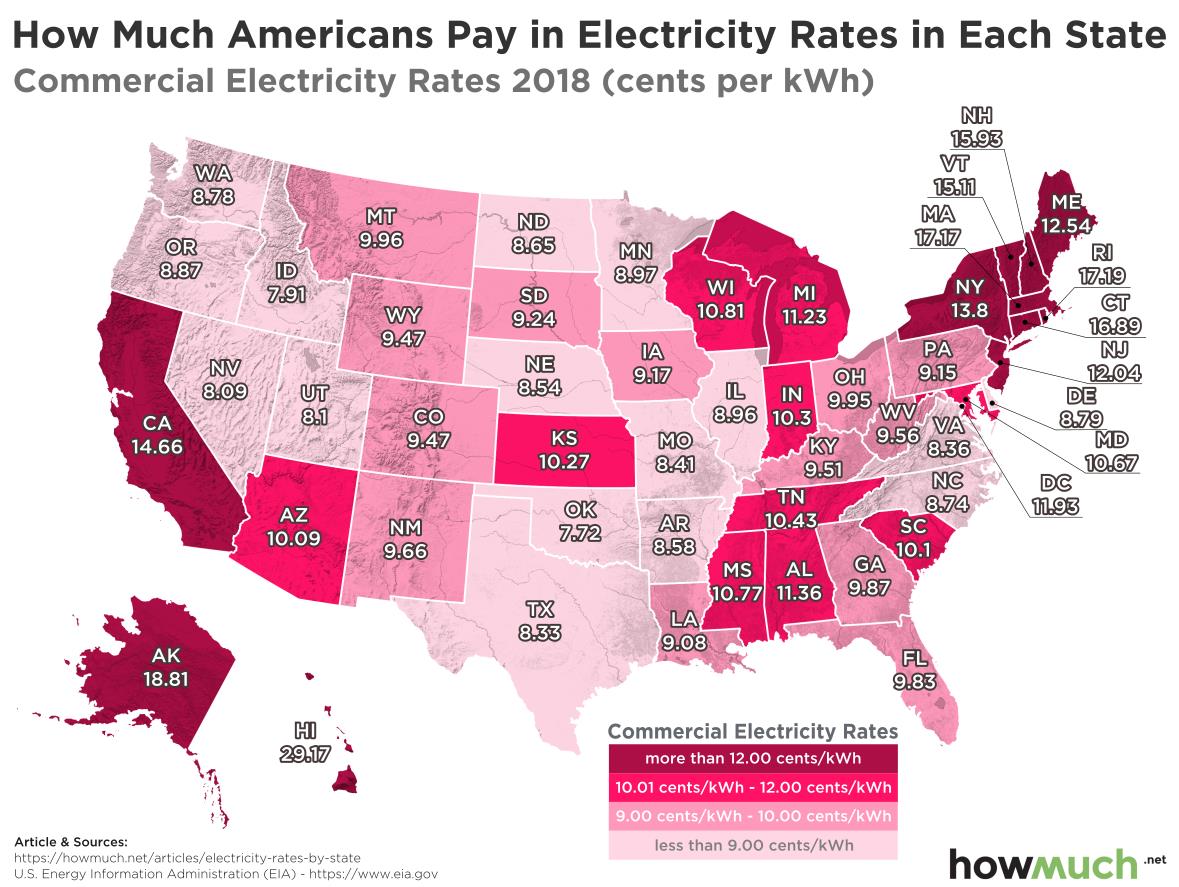
Top 5 States with the Priciest Commercial Electricity Rates (cents/kWh)
1. Hawaii: 29.17
2. Alaska: 18.81
3. Rhode Island: 17.19
4. Massachusetts: 17.17
5. Connecticut: 16.89
Our maps reveal a few key similarities between the residential and commercial electrical markets. Let’s start by considering the Northeast, the region in which electricity is the most expensive. Both residential and business consumers pay above-average rates in states like Connecticut and New York because of the large population centers. In other words, our maps clearly illustrate how high levels of demand increase cost. The same can be said about California, where the combination of large cities and a strong environmental movement decrease the availability of things like coal-fired power plants. Alaska’s status as an expensive market makes a certain amount of sense, too—it costs a lot of money for any company to electrify the last frontier. Curiously, both maps highlight how Wisconsin and Michigan pay above average, too, owing perhaps to their location far away from natural gas and coal repositories.
Both maps are also in agreement at the opposite end of the spectrum. The cheapest markets tend to be in the deep South and other very rural states. The best prices for residential electricity are in Louisiana (9.05 cents/kWH) and the best rates for commercial electricity are in Oklahoma (7.72 cents/kWh). At a glance, there are light shades in both maps throughout the country’s midsection.
Finally, there are a few surprises beneath the surface as well. In general, consumers pay a higher rate for electricity than businesses (13.31 vs. 10.00 cents/kWh). Oddly enough, Tennessee and Louisiana are the only two states where consumers pay a better rate; every other state has a better price for commercial customers. Pennsylvania has the greatest disparity between the two rates—businesses pay 4.69 cents/kWh less than consumers, which comes out to a 33% discount.
The big takeaway from our maps is that even in a highly regulated market—including one in which the President intervenes to bail out major companies—the laws of supply and demand still determine price.
Data: Table 1.1
About the article
Authors
Irena - Editor


