The primary benefit of renting an apartment is flexibility. Renters can move to a different neighborhood (or another city altogether) without worrying about selling their homes. But, according to our latest analysis, that flexibility often comes at a cost—renting is more expensive on average in 40 out of 50 states.
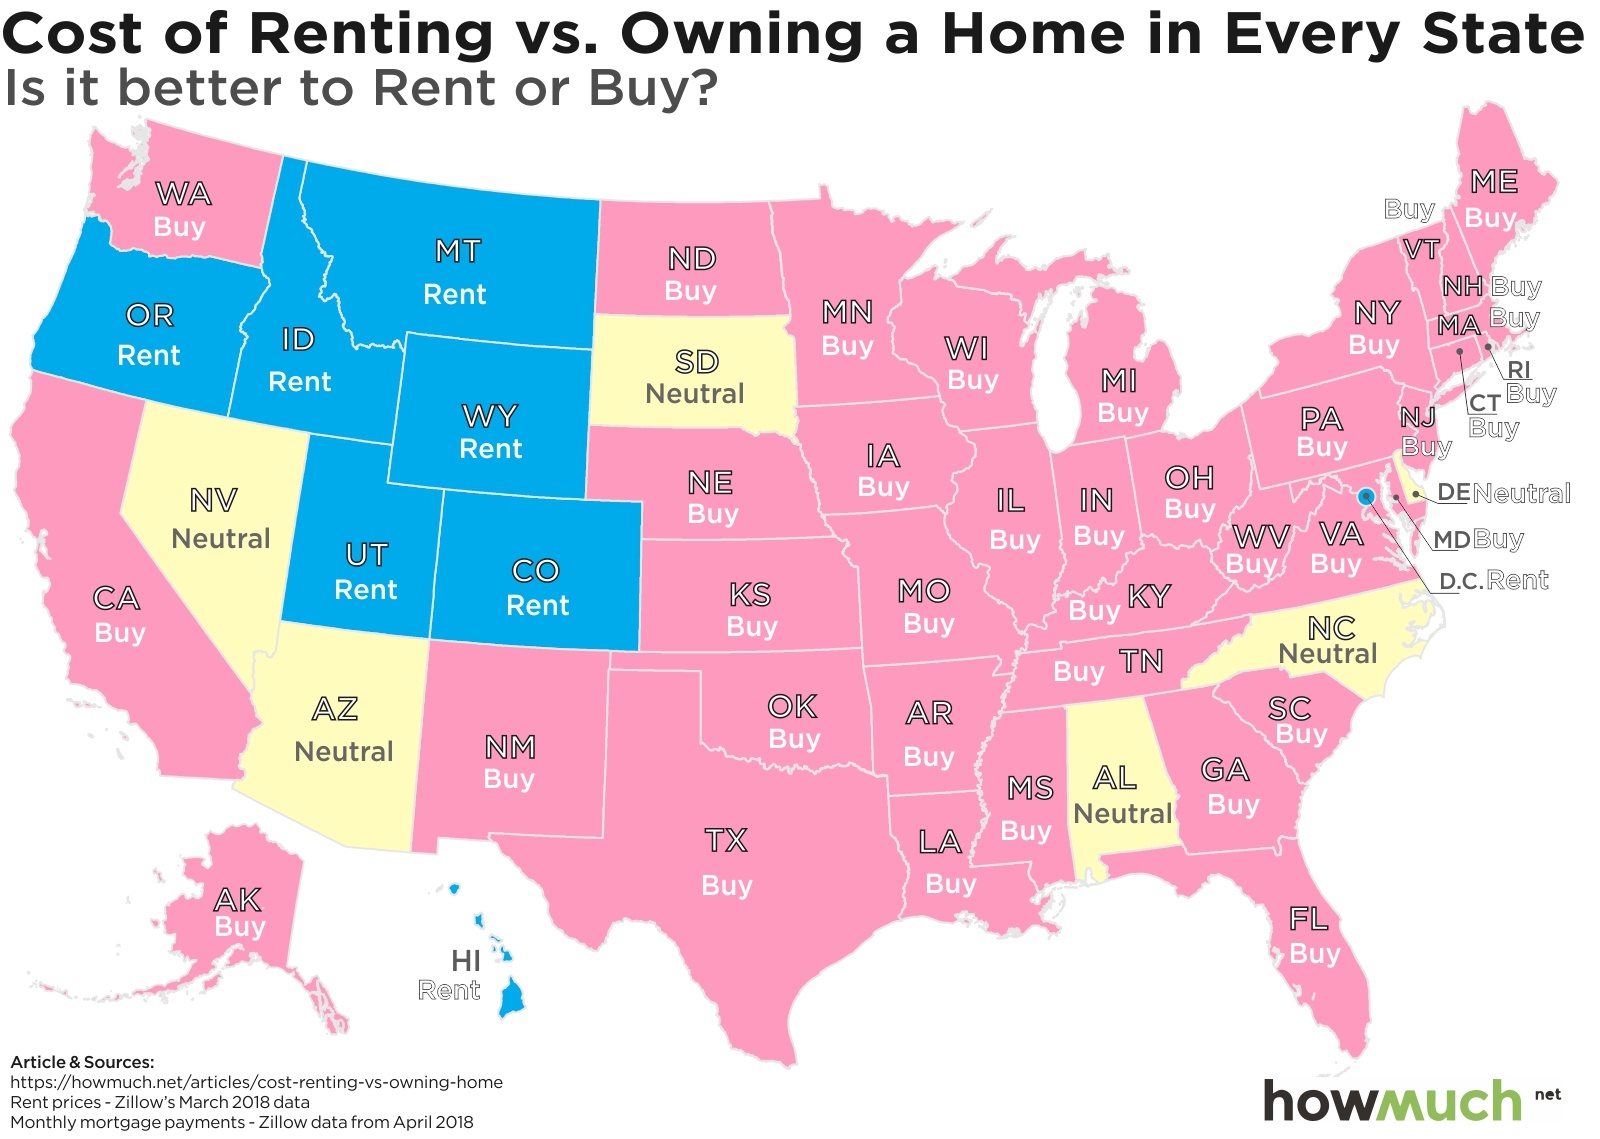 The numbers for our map and visualization come from Zillow’s housing data for March 2018, but our friends at GoBankingRates actually collected it. The map provides an intuitive look at the geography of renting vs. owning. We used a simple cutoff to compare buying and renting—if the difference was less than $50/month either way, we classified the state as neutral. That’s simply not enough money for us to make a judgement about if owning a home makes sense. But with a difference of more than about $50/month, the scales begin to tip in favor of one or the other.
 We also wanted to visualize the numbers another way to understand the total cost of living across the US. We created a stacked bar chart comparing average monthly mortgage payments (pink) and monthly rent payments (blue). This approach lets you easily see which states have a significantly higher cost of living, and which are relatively cheap in comparison.
These are the ten states where it makes the least sense to rent a home (the amounts are for the average mortgage minus the average rent):
1. New York: -$1,471
2. Maine: -$675
3. Rhode Island: -$656
4. Massachusetts: -$586
5. Illinois: -$471
6. New Jersey: -$437
7. Florida: -$404
8. Vermont: -$379
9. Pennsylvania: -$368
10. Ohio: -$296
Both the map and the visualization give us a unique insight into the age-old debate about the merits of renting vs. buying. For starters, it is definitely more financially savvy to purchase in the great majority of US states. The only pocket where it’s better to rent than own is out West, plus a few outliers in Washington, DC, and Hawaii. Our data are from March, 2018 when mortgage rates were already trending upward. Only time will tell if the housing market cools off, but clearly homeowners are getting a better bargain than renters.
Our visualization also highlights the vast differences in the housing market across the country. At the very uppermost end of the spectrum, owners in Hawaii shell out an eye-popping $2,839 on average each month. Renters don’t fare much better, spending $2,300. Compare that to the bottom of the graph, where West Virginians spend a relatively tiny $778 to own a home or $1,000 as renters. Across the country, the average difference is -$186 in favor of owning. That might not sound like a lot of money, but it comes out to $2,232 every year. Multiply that savings across a 30-year mortgage—and consider the prospect of building equity every month—and that’s real money.
Data: Table 1.1
About the article
Authors
Irena - Editor


