The global economy has expanded rapidly over several centuries. Through depressions, wars, and other events, the world economy has continued to develop at an exponential rate. Starting at about $184 billion in the year 1 AC, the world’s GDP has risen to an astounding $120 trillion.
However, while the world’s GDP is as high as it has ever been, the world economy still faces a number of issues. Despite immense global wealth, a large number of countries struggle with extreme poverty and economic fragility. With these themes in mind, we gathered 10 of our visualizations to illustrate the complexities of the world economy.

- The U.S. economy has steadily grown since the Great Recession; however, it may finally be starting to slow down.
- Services make up the largest portion of the world’s GDP, followed by industry, then agriculture.
- Some of the world’s largest economies are also some of the most fragile.
- The world’s GDP has increased at an incredible rate over the years despite economic hardships, wars, and other major events.
How GDP Changed Through Written History

This first visualization illustrates the growth of the world economy, dating back to 3000 BC. This graphic also demonstrates how new methods for exchanging goods have developed. While we once relied on the barter system, civilization has evolved to use paper money and credit cards to drive economic growth.
Today’s Economic Leaders and Laggards of the World
 We can start to take a deeper look into the world economy by analyzing each country’s GDP per capita. This metric places a value on each country’s economic output produced by each person who lives in the country.
You’ll notice that major economic powers like China have relatively low GDPs per capita despite having very high GDPs. While these countries have high economic output, the GDP per capita paints a more accurate picture of the standard of living in these nations.
Does a Low Cost of Living Help the Ones Behind Catch Up?
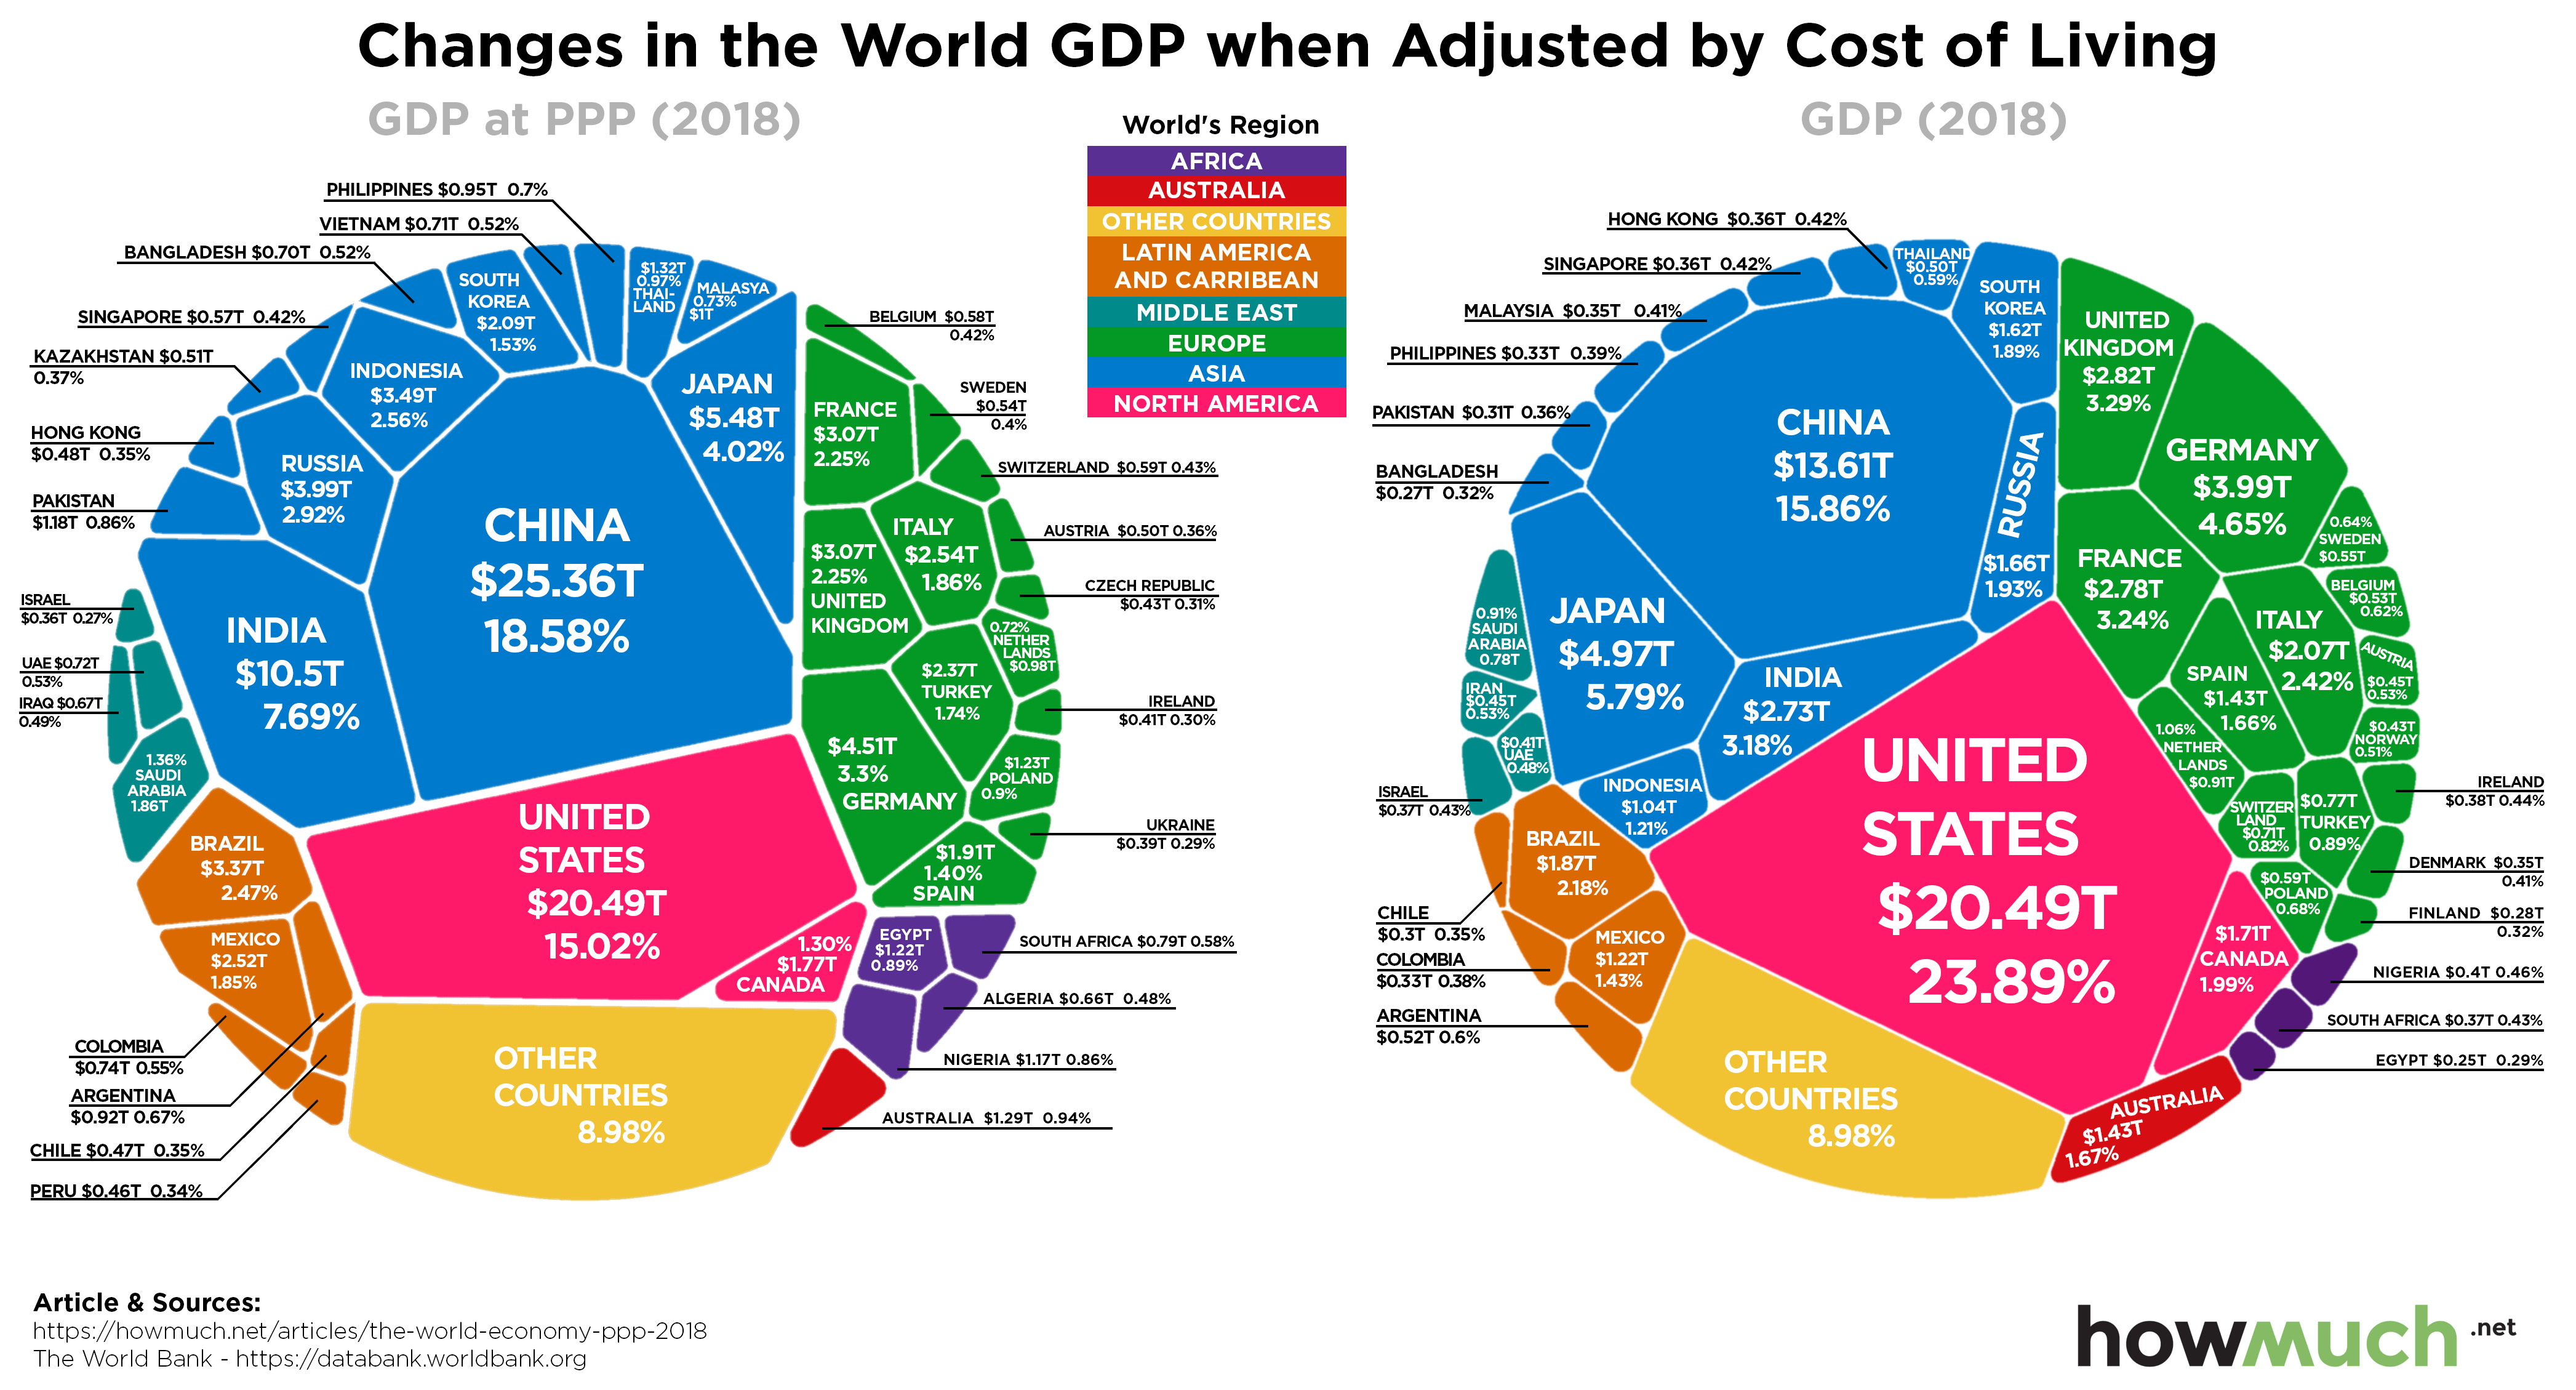 Purchasing power parity (PPP) is a common metric for comparing economies between countries as it accounts for the differences in standards of living when comparing the economic output.
Based on this metric, we can see that the United States economy has grown every year since the Great Recession, though some think it may finally be slowing. Interestingly, when you look at GDP adjusted for purchasing power, China surpasses the U.S. China’s low cost of living drives the base $13.61 trillion to $25.36 trillion.
Those Who Feed Us Tend to Come From Developing Economies
 These next three graphics visualize the importance of three sectors in the world’s economy.
Above, you can see that agriculture plays a surprisingly small role in the world economy, accounting for only 3% of the world’s GDP. Developed nations with powerful economies tend to depend less on the agriculture industry than underdeveloped countries around the world.
Does Dominating Industry Get You Ahead?
 Industry plays a much more substantial role in the world economy than agriculture. This sector accounts for a significant 25% of the world’s GDP and is particularly important in developing countries.
In general, industry as a share of total GDP is highest in the Middle East, East Asia, and sub-Saharan Africa.
Or We Reward Service Based Economies?
 The services industry is by far the largest contributor to the world’s economy. Services account for at least 50% of the GDP in over half of the world’s countries and about 65% of the world’s GDP.
Services as a percentage of GDP is generally highest in developed nations, such as the United States. In the U.S. services account for an astounding 77% of the GDP.
The Largest Recipients of Investment
 Countries with large budget surpluses have to find something to do with their extra cash. Since domestic investment opportunities are limited, many countries turn to foreign direct investments (FDI). These are investments made in companies located in foreign nations.
China and the United States are, by far, the biggest beneficiaries of FDIs. These investments are generally a good thing as they contribute to job growth in the nations receiving these investments.
Also Invest in Their Future
 Research and development (R&D) is seen by many as a great indicator of long-term economic strength. Investing in R&D allows countries to make meaningful advances in important sectors, which allows these countries to improve their economies. This can include anything from artificial intelligence to agriculture.
Unsurprisingly, countries with high GDPs spend more on research and development than other nations. The U.S. and China, in particular, spend far more on R&D than any other country in the world.
Not All Giant Economies Have Secure Economic Stability
 A high GDP isn’t always indicative of a strong economy. Hard data such as economic indicators, security, strength of factions, and other indicators are used to measure the fragility of economies around the world.
While China and the U.S. are the world’s largest economic powerhouses, neither country makes it into the top 10 most stable countries in the world. Instead, this list is dominated by European nations such as Finland, Norway, and Switzerland. Meanwhile, many of the world’s most unstable economies are found in Africa.
Yet, Countries With Minimal Economies Tend to Suffer Extreme Poverty
 Lastly, extreme poverty is often used as a metric to measure quality of life in countries around the world. While we often focus on the wealth of the world’s nations, it’s just as important to understand how much of the world’s population is living below the international poverty line.
The United States has a fairly low extreme poverty rate, as does China, England, Japan, and many other major economies. Meanwhile, in countries like Somalia, the majority of the population is living under extreme poverty.
The world economy is very complex and interconnected. While the world economy may be dominated by a select few countries, every country plays an important role in the development of the global economy. By examining these 10 visualizations, we can see how the world economy has performed throughout history and where it might be going next.
So what really drives the global economy? Does investment in a country payoff, or is it wasted spending? Let us know your thoughts.
About the article
Authors
Irena - Editor


