
April 3rd, 2026
business
The Economy
taxes
The U.S. doesn’t have a competitive top corporate tax rate. These maps breakdown which countries charge companies the most, and which ones charge the least

April 3rd, 2026
The Economy
taxes
Here’s how top capital gain tax rates could change under President Biden’s latest proposal

April 3rd, 2026
The Economy
taxes
This visualization breaks down total tax revenue statistics by each country in the OECD
April 3rd, 2026
Personal Finance
business
taxes
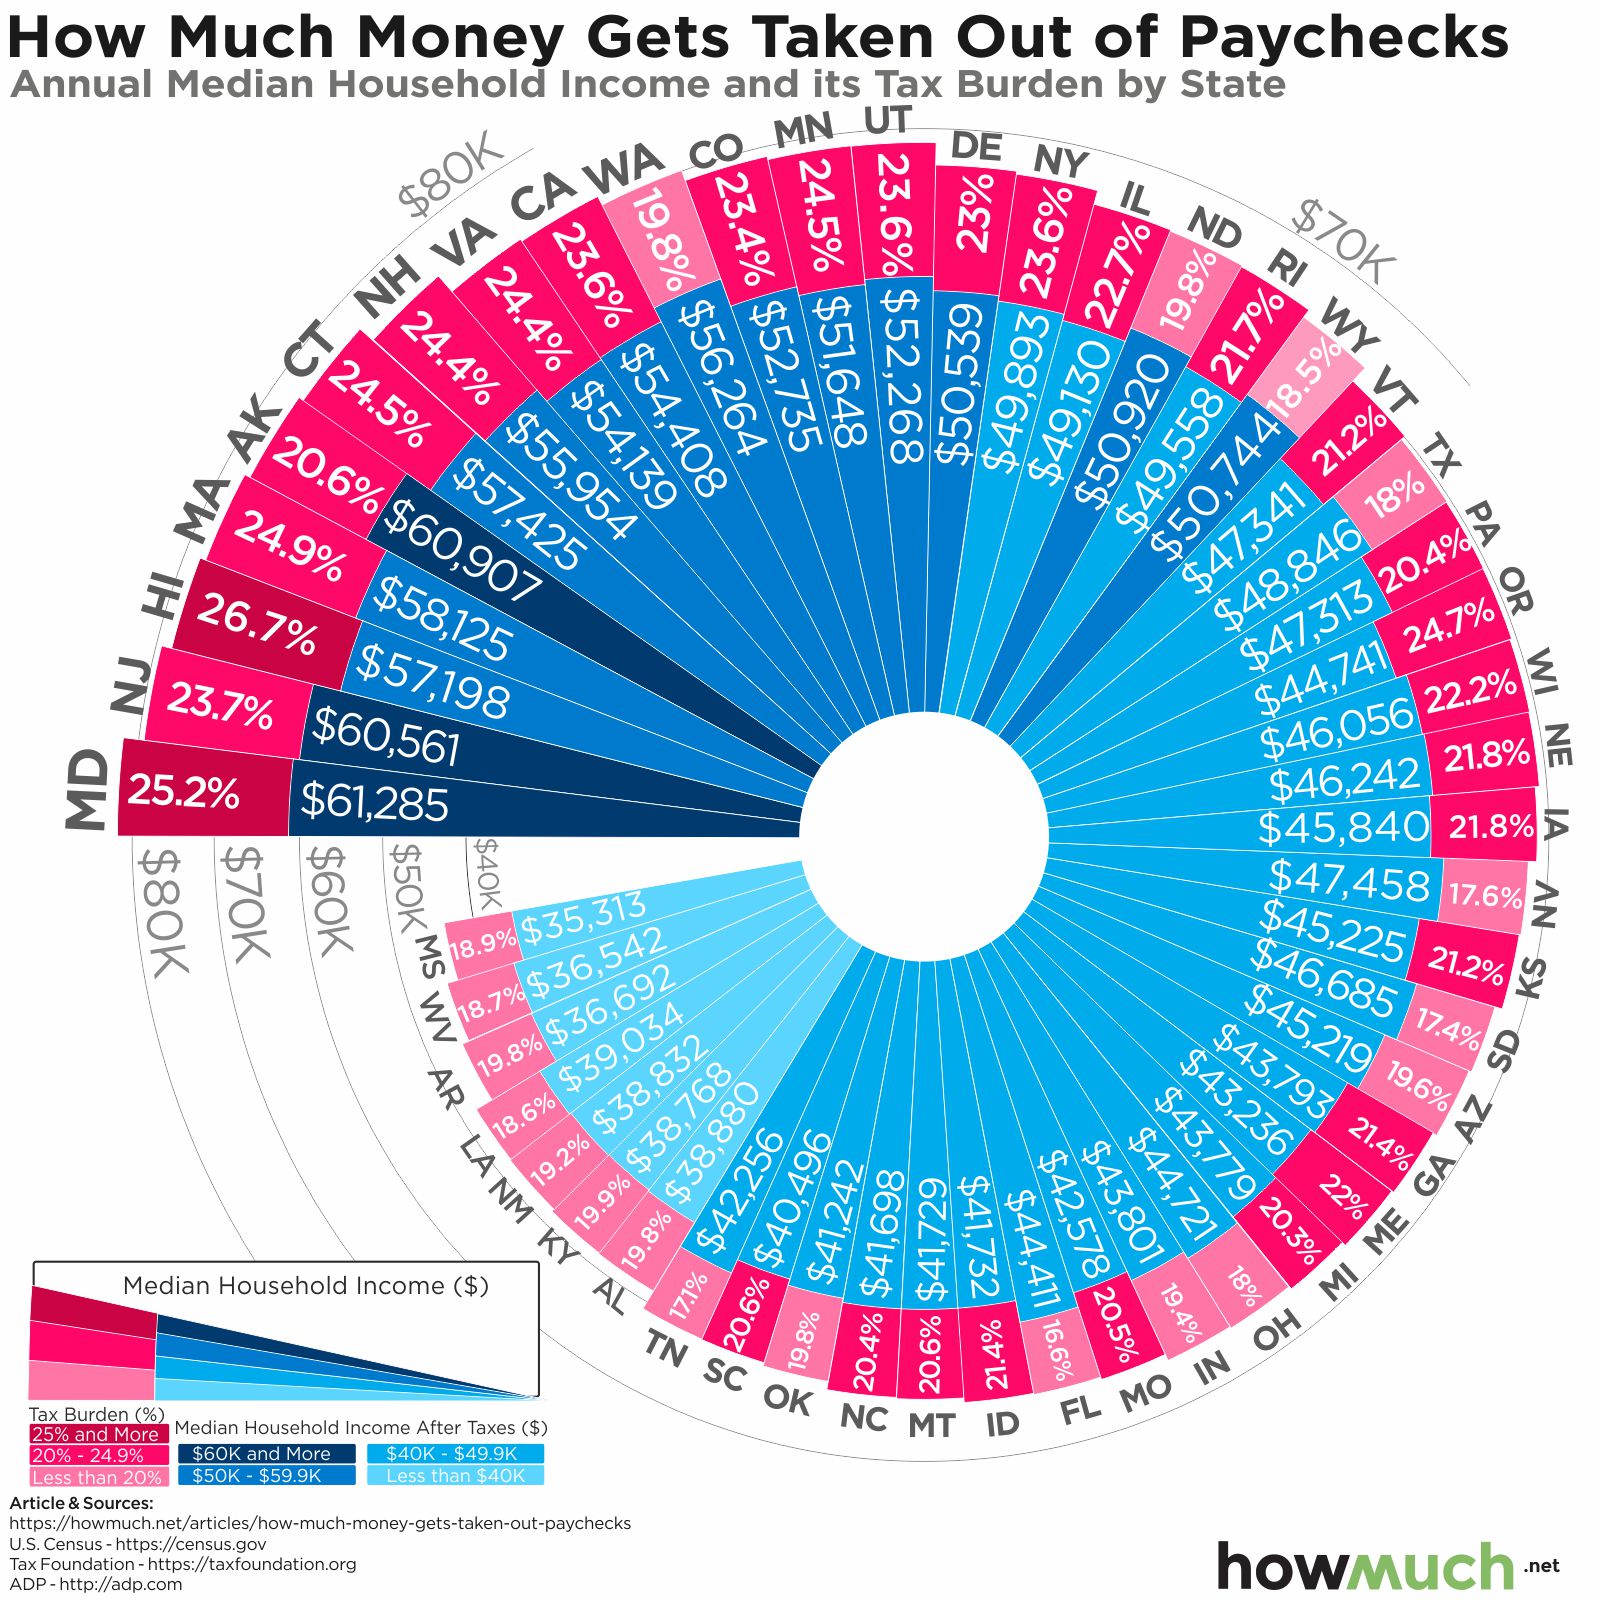
This visualization breaks down how much workers are paying in taxes, demonstrating how the tax burden wildly varies around the country.

April 3rd, 2026
The Economy
taxes
social-issues
monetary-policy
With $150b approved, Congress hopes to blunt the impact to state and local governments through a direct infusion of cash. Our visualization highlights the approach taken by lawmakers to divvy up the funds.

April 3rd, 2026
Personal Finance
taxes
social-issues
Ever wondered how your state’s tax system compares to others? Here’s an overview of the U.S. state tax system based on seven visualizations.

April 3rd, 2026
Personal Finance
business
The Economy
taxes
debt
jobs
We covered lots of different topics in 2019, from the cost of a comfortable retirement to the looming government debt bubble and the world’s gold reserves. Here’s what we deemed the 10 best visualizations for the year

April 3rd, 2026
Personal Finance
taxes
States tax lots of different things, like income, property, sales and sins like tobacco and alcohol. Our visualization breaks down the most and least friendly states for total taxation in the country.
April 3rd, 2026
The Economy
taxes
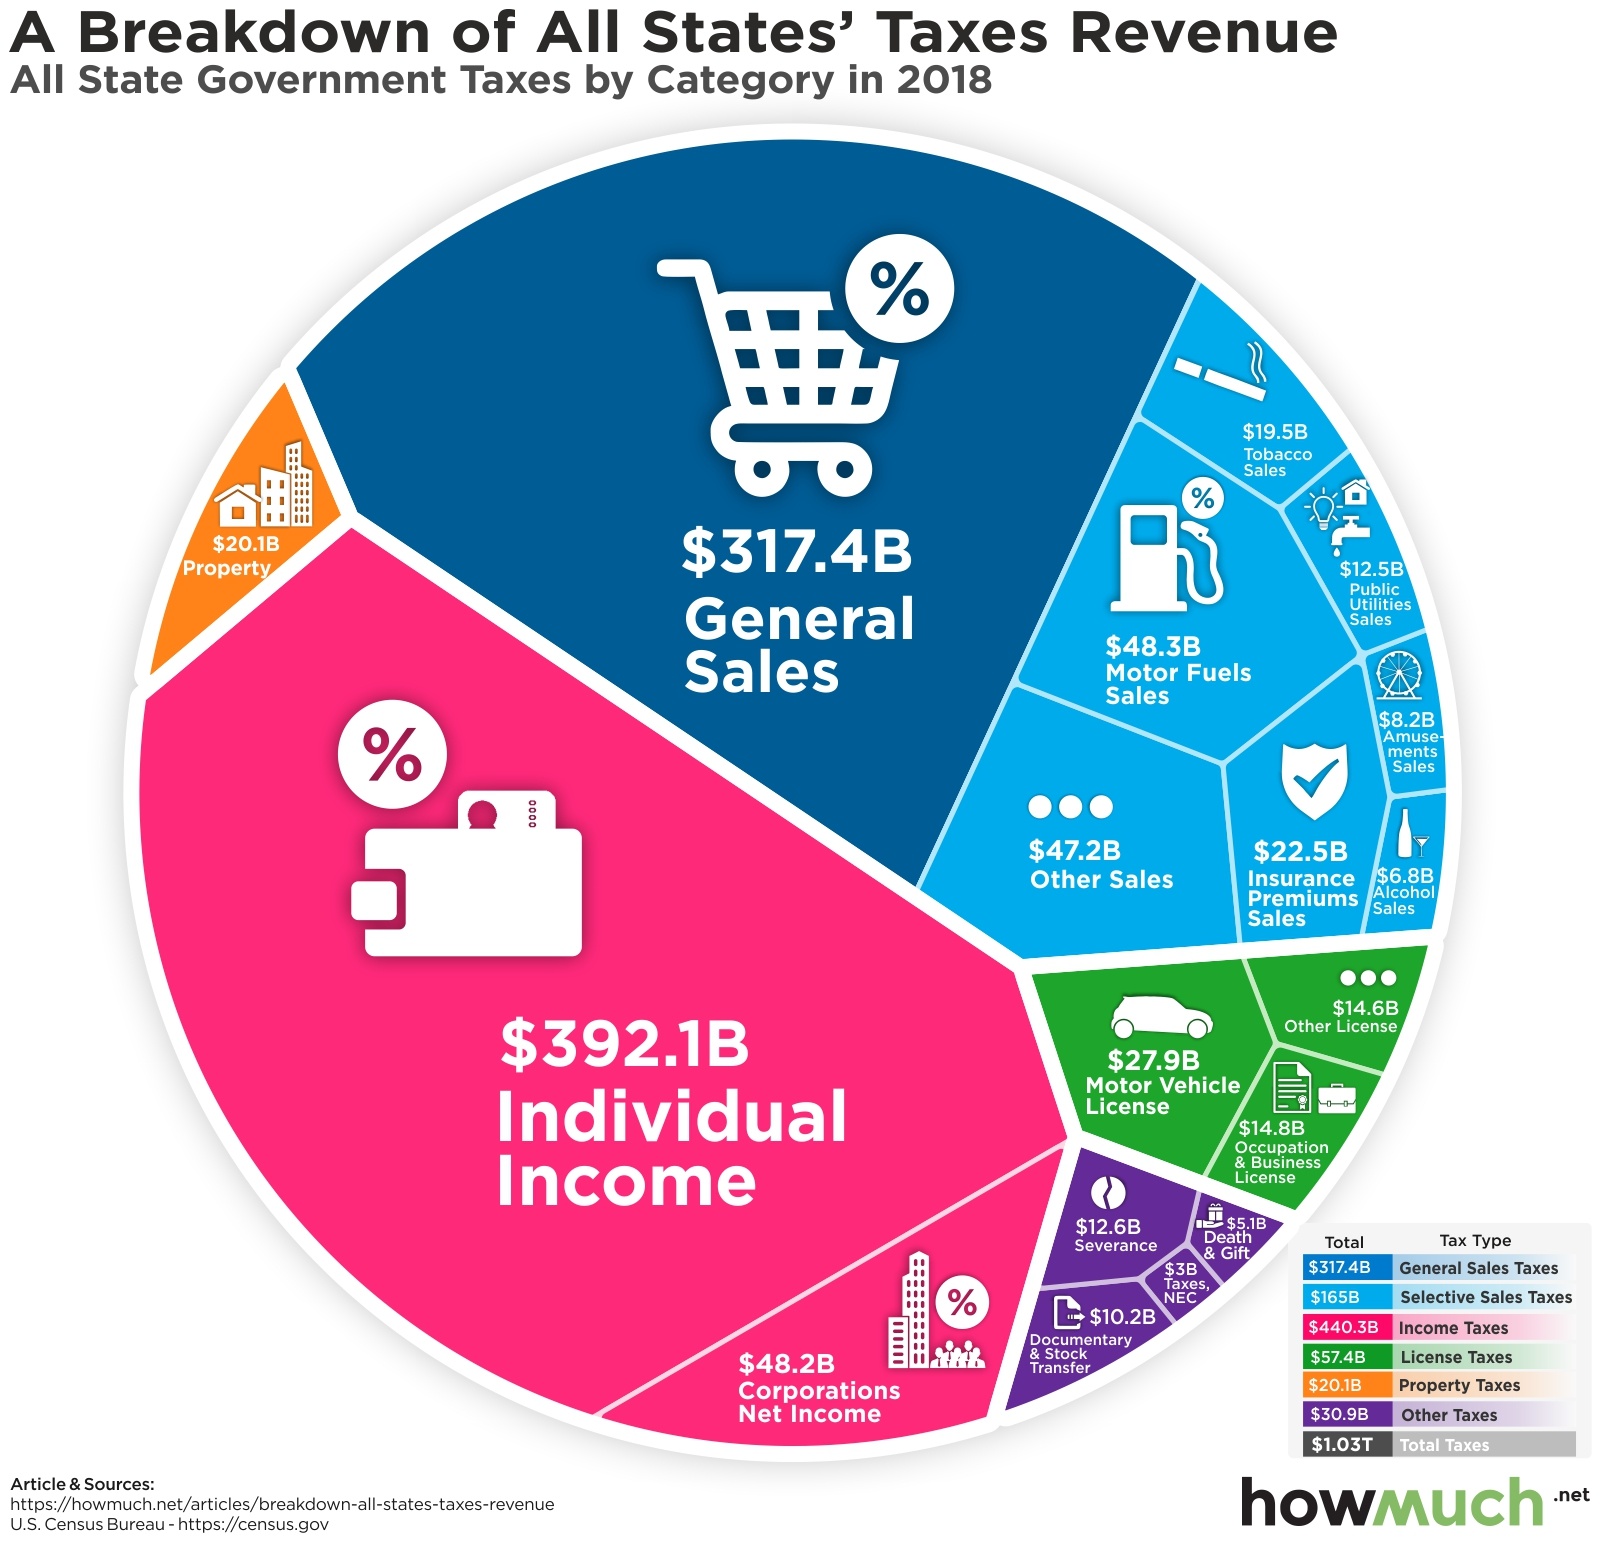
Both the federal and state governments in the U.S. are facing tax shortfalls. Where do states collect their taxes now, and what other revenue sources are presidential candidates suggesting?

April 3rd, 2026
Personal Finance
taxes
Wealth
As the April 15 deadline rapidly approaches, taxes are on national mind. Even though everyone’s tax situation is unique, there are a number of taxation trends at the state level which suggest that not everyone is paying their fair share