April 3rd, 2026
The Economy
debt
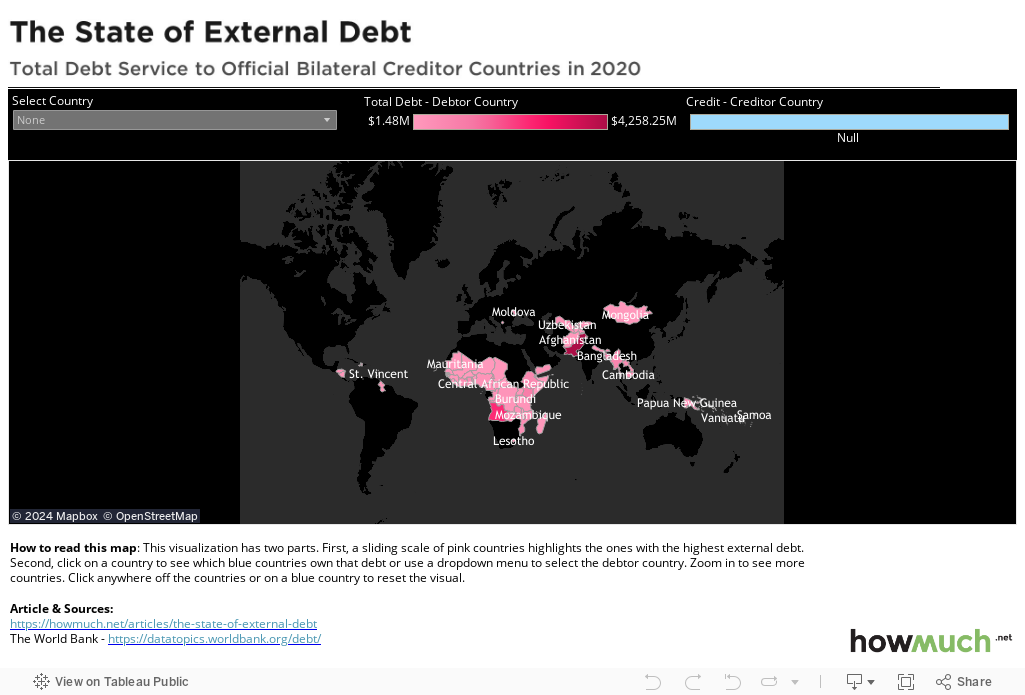
This interactive visualization lets you explore which poor countries are taking on the most debt due to COVID-19, and their biggest creditors.

April 3rd, 2026
The Economy
debt
Here’s the best way to visualize which countries have the worst debt to GDP ratios in the world

April 3rd, 2026
The Economy
debt
Here is how U.S. household debt has changed across multiple categories over the last several years
April 3rd, 2026
The Economy
debt
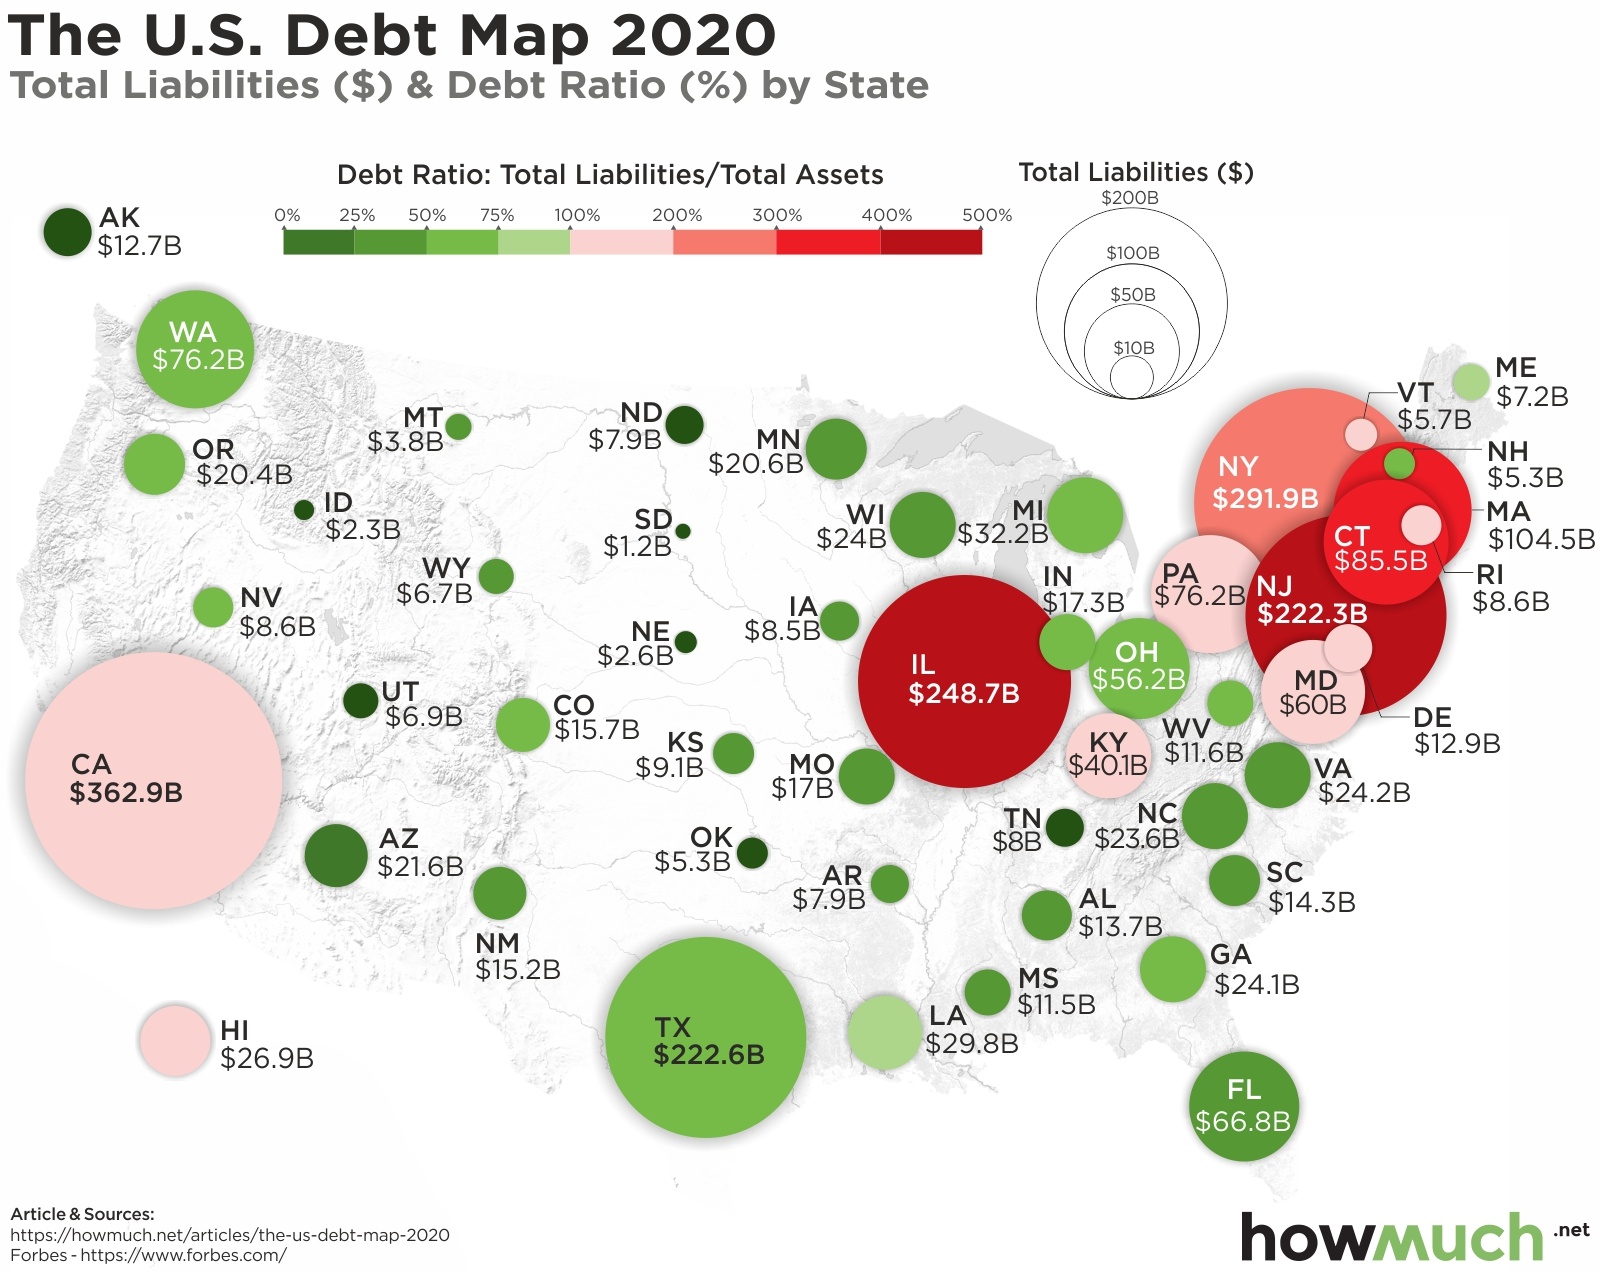
This map shows which states have the biggest problems with out-of-control debt levels, and which ones are weathering the pandemic with strong balance sheets

April 3rd, 2026
The Economy
debt
Crushing student loan debt is a drag on the U.S economy. These are the schools responsible for originating the most student loans in every state around the country

April 3rd, 2026
Personal Finance
debt
A lot of people are paying down their credit cards during the COVID-19 pandemic. These visualizations show which states and generations are making the most progress

April 3rd, 2026
The Economy
debt
The U.S. debt continues to skyrocket thanks to the coronavirus pandemic. This visualization breaks down the biggest foreign holders of U.S. government debt

April 3rd, 2026
The Economy
social-issues
debt
This visualization charts the major events associated with an ever-climbing level of national debt.

April 3rd, 2026
Personal Finance
social-issues
debt
monetary-policy
From coast to coast, consumer debt in America continues to grow.
April 3rd, 2026
Personal Finance
debt
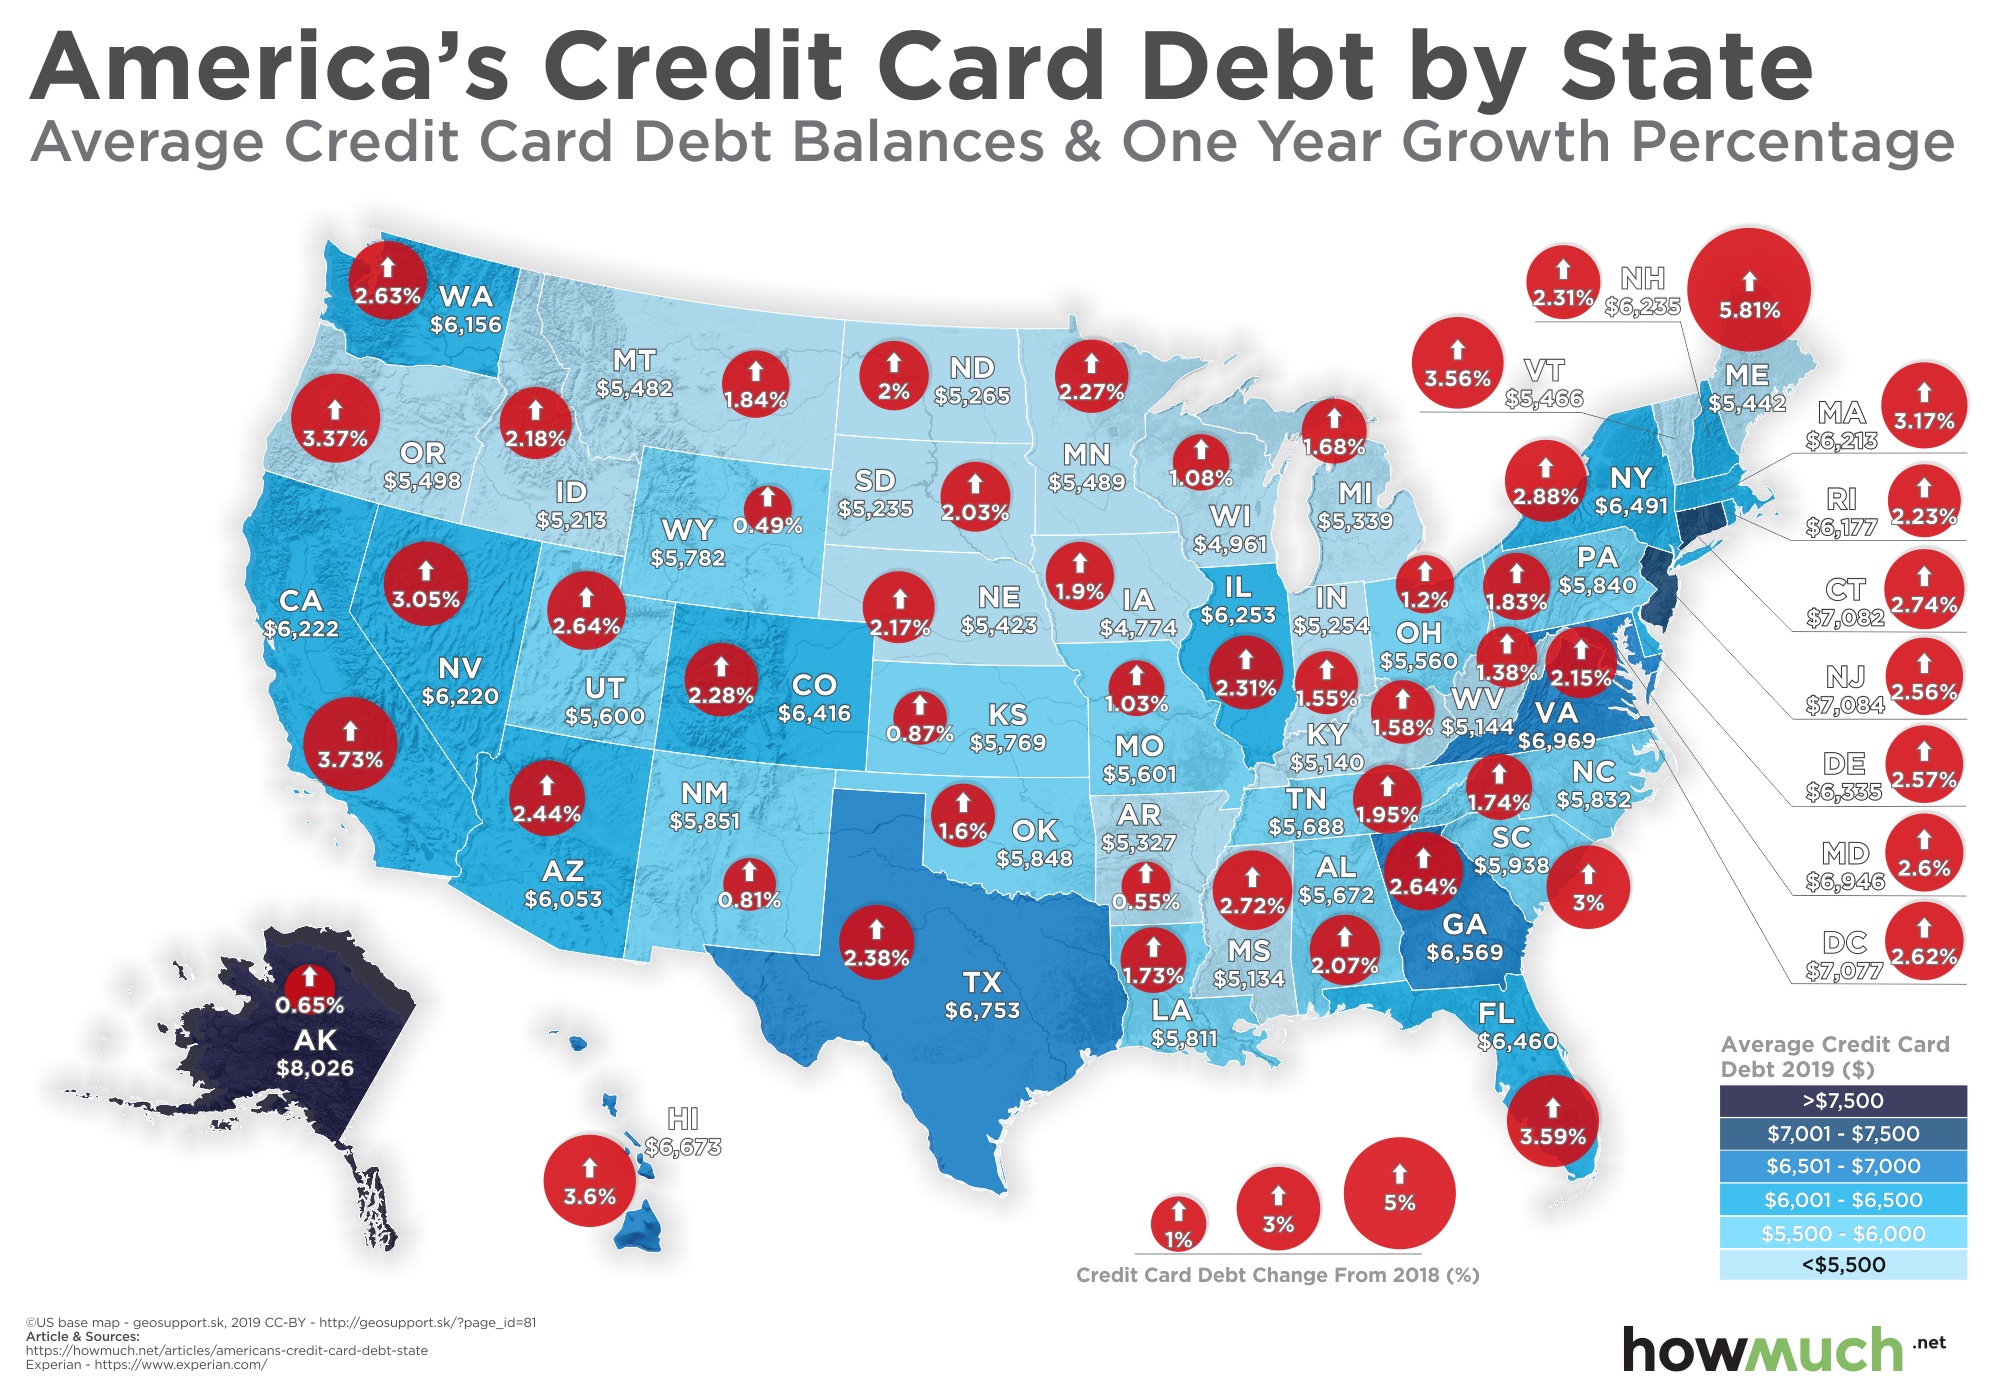
Credit card debt is up across the nation. What states are most affected, and why?