GDP per capita is a critical metric for understanding the economy.
It’s a measure of a country’s economic output that takes into account the number of people who live there. GDP per capita takes the gross domestic product and divides it by the number of people who live there. It’s the best measurement of a country's standard of living. It tells you how prosperous a country feels to each of its citizens.

We gathered the data for our series of maps from the International Monetary Fund. The color corresponds to the GDP per capita in each country, with dark green being the richest at over $100,000 and dark pink the poorest at less than $1,000. A few countries are shaded light gray because data were not available.
We wanted to break down this world map in a new light to really unearth the vast differences of wealth it displays. So, we added an additional dimension of size for each region also corresponding to per capita GDP, letting you quickly grasp a comparison between countries apples-to-apples. Of course, GDP per capita doesn’t necessarily indicate high levels of disposable income, but our approach does let you easily see where the wealthiest countries are.

In North America, it’s no surprise to see the United States in dark green at the head of the pack ($62,518). That’s one of the highest in the world, and it’s especially impressive given how over 328 million people live in the U.S. Canada also stands out as a rich nation ($46,733), but take a look at Puerto Rico ($32,004) and Aruba ($24,881) compared to the rest of the Caribbean and Central America. These countries are poor compared to the U.S. and Canada, but they’re several magnitudes wealthier than places like Nicaragua ($2,127) and Honduras ($2,829).
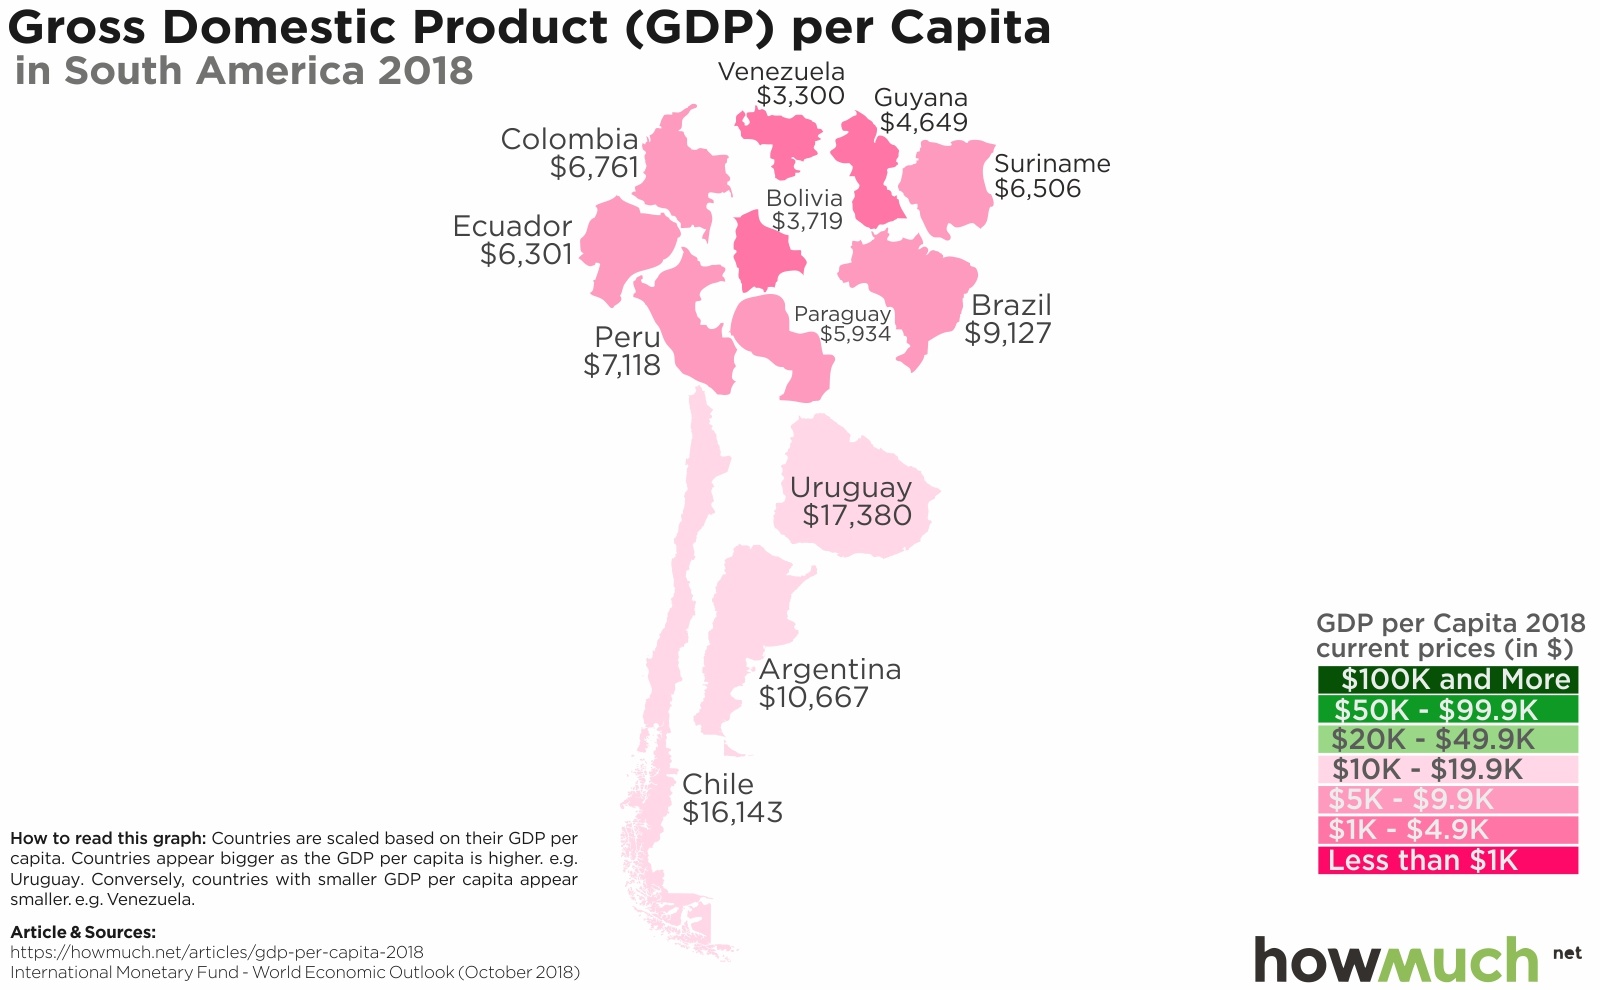
South America looks like an explosion of small pink countries, indicating a relatively low GDP per capita. Uruguay is the most well-off ($17,380), followed by Chile ($16,143). Compare these countries to Brazil ($9,127), which usually gets a lot of press attention for the overall size of its economy. Our visualization puts things in perspective that even if Brazil’s economy is critical to the world, the people who live there are relatively poor compared to their neighbors, much less North America.

The situation across the pond is eye-opening. There is a clear and obvious division between the wealthy, large and green countries in the West and the poor, small and pink countries in the East. Just compare Luxembourg ($113,954) with Moldova ($3,227). This tells you a lot about where the economic power lies on the European continent.

There is likewise a stark illustration of inequality Down Under. Australia ($56,698) boasts by far the highest GDP per capita, followed by New Zealand ($41,616), both of which are developed economies. The rest of Oceania, however, contains a large number of relatively poor countries.

Our visualization is perhaps most appealing when it comes to Asia because of the way it distorts the countries. Geographically, Russia and China dominate the entire continent, but not when it comes to GDP per capita (a measly $10,950 and $9,633, respectively). The countries with real economic clout when you consider the size of their populations are all located further south, especially in the Middle East. Macao, a gambling outpost technically part of China, is incredibly wealthy by these standards ($81,585).

And finally, there’s Africa, the all-around poorest continent on the planet. There isn’t a single country over $20,000. There are several below $1,000, including Malawi ($349), Burundi ($307) and South Sudan ($307).
It’s hard to comprehend just how enormous the disparities on our maps are. If the U.S. has a GDP per capita of $62,518 and Burundi only has $307, what does that mean? In short, all things being equal and when adjusted for population, the economy produces 203 times more for Americans.
Data: Table 1.1
About the article
Authors
Irena - Editor


