
April 3rd, 2026
Personal Finance
business
The Economy
Insurance companies took in hundreds of millions last year in direct premiums. Here are the top 10 winners in each sector

April 3rd, 2026
business
The Economy
taxes
The U.S. doesn’t have a competitive top corporate tax rate. These maps breakdown which countries charge companies the most, and which ones charge the least

April 3rd, 2026
business
The Economy
social-issues
Our top 5 favorite visualizations from the last month beautifully illustrate key insights into the coronavirus pandemic, data breaches and the world’s population

April 3rd, 2026
business
The Economy
investments
U.S. airlines saw record losses in 2020. Here’s how the stock market responded
April 3rd, 2026
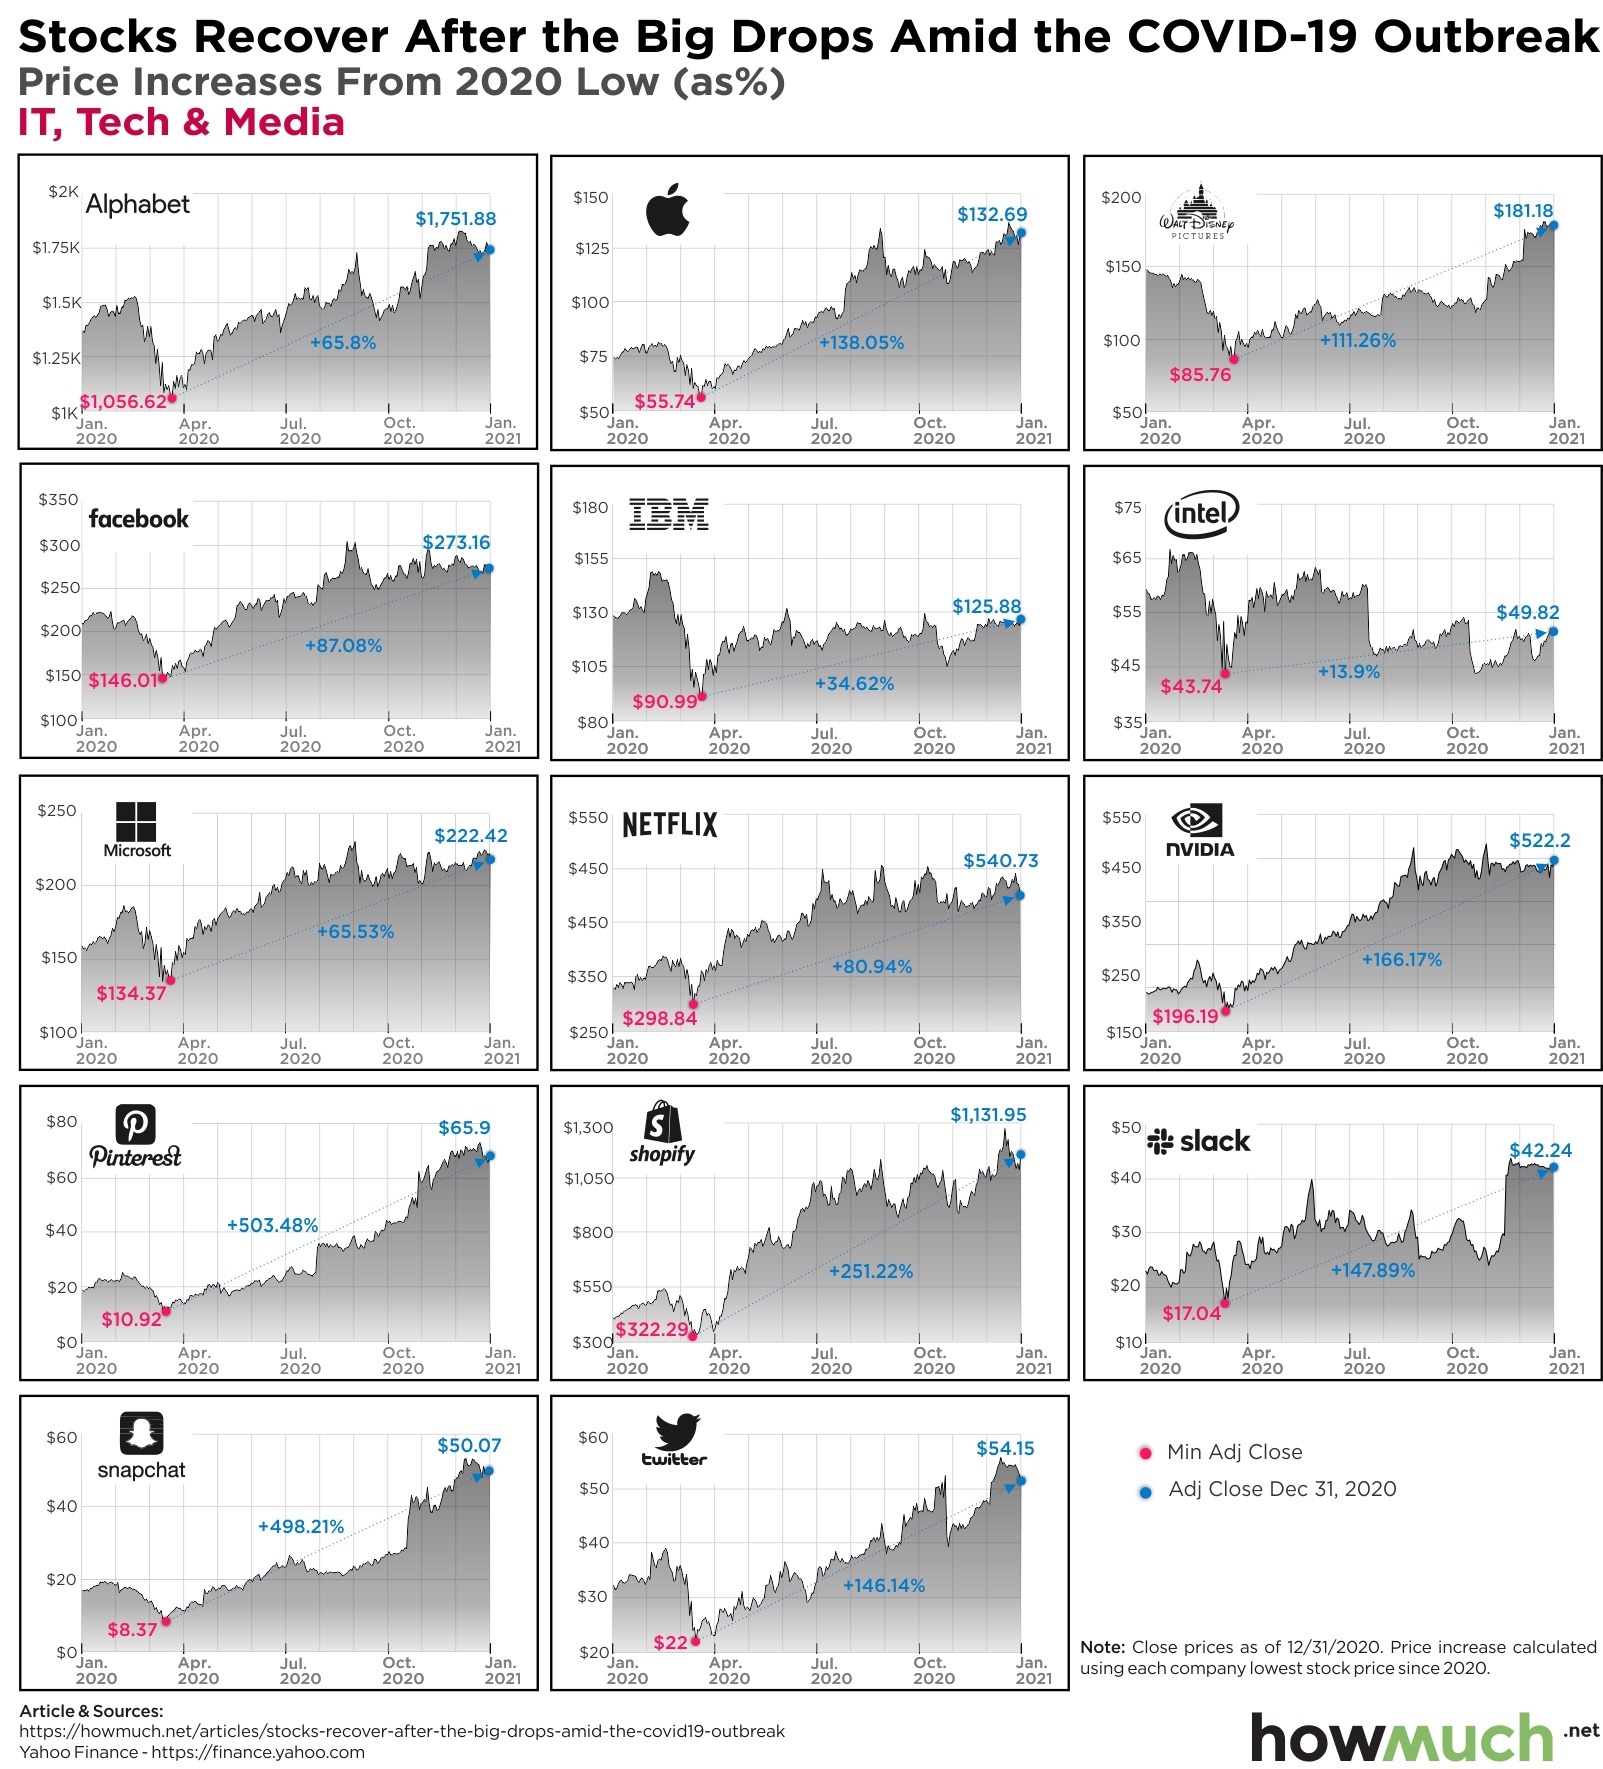
business
The Economy
These charts show which companies have seen their stock prices improve by the end of 2020

April 3rd, 2026
Personal Finance
business
The Economy
Wealth
Almost every state in the country is home to at least one billionaire, according to our latest map of the richest people across the U.S.

April 3rd, 2026
business
The Economy
2020 was a bad year, but not for the stock market. The S&P 500 turned in one of its best annual performances despite many enduring challenges from a difficult year
April 3rd, 2026
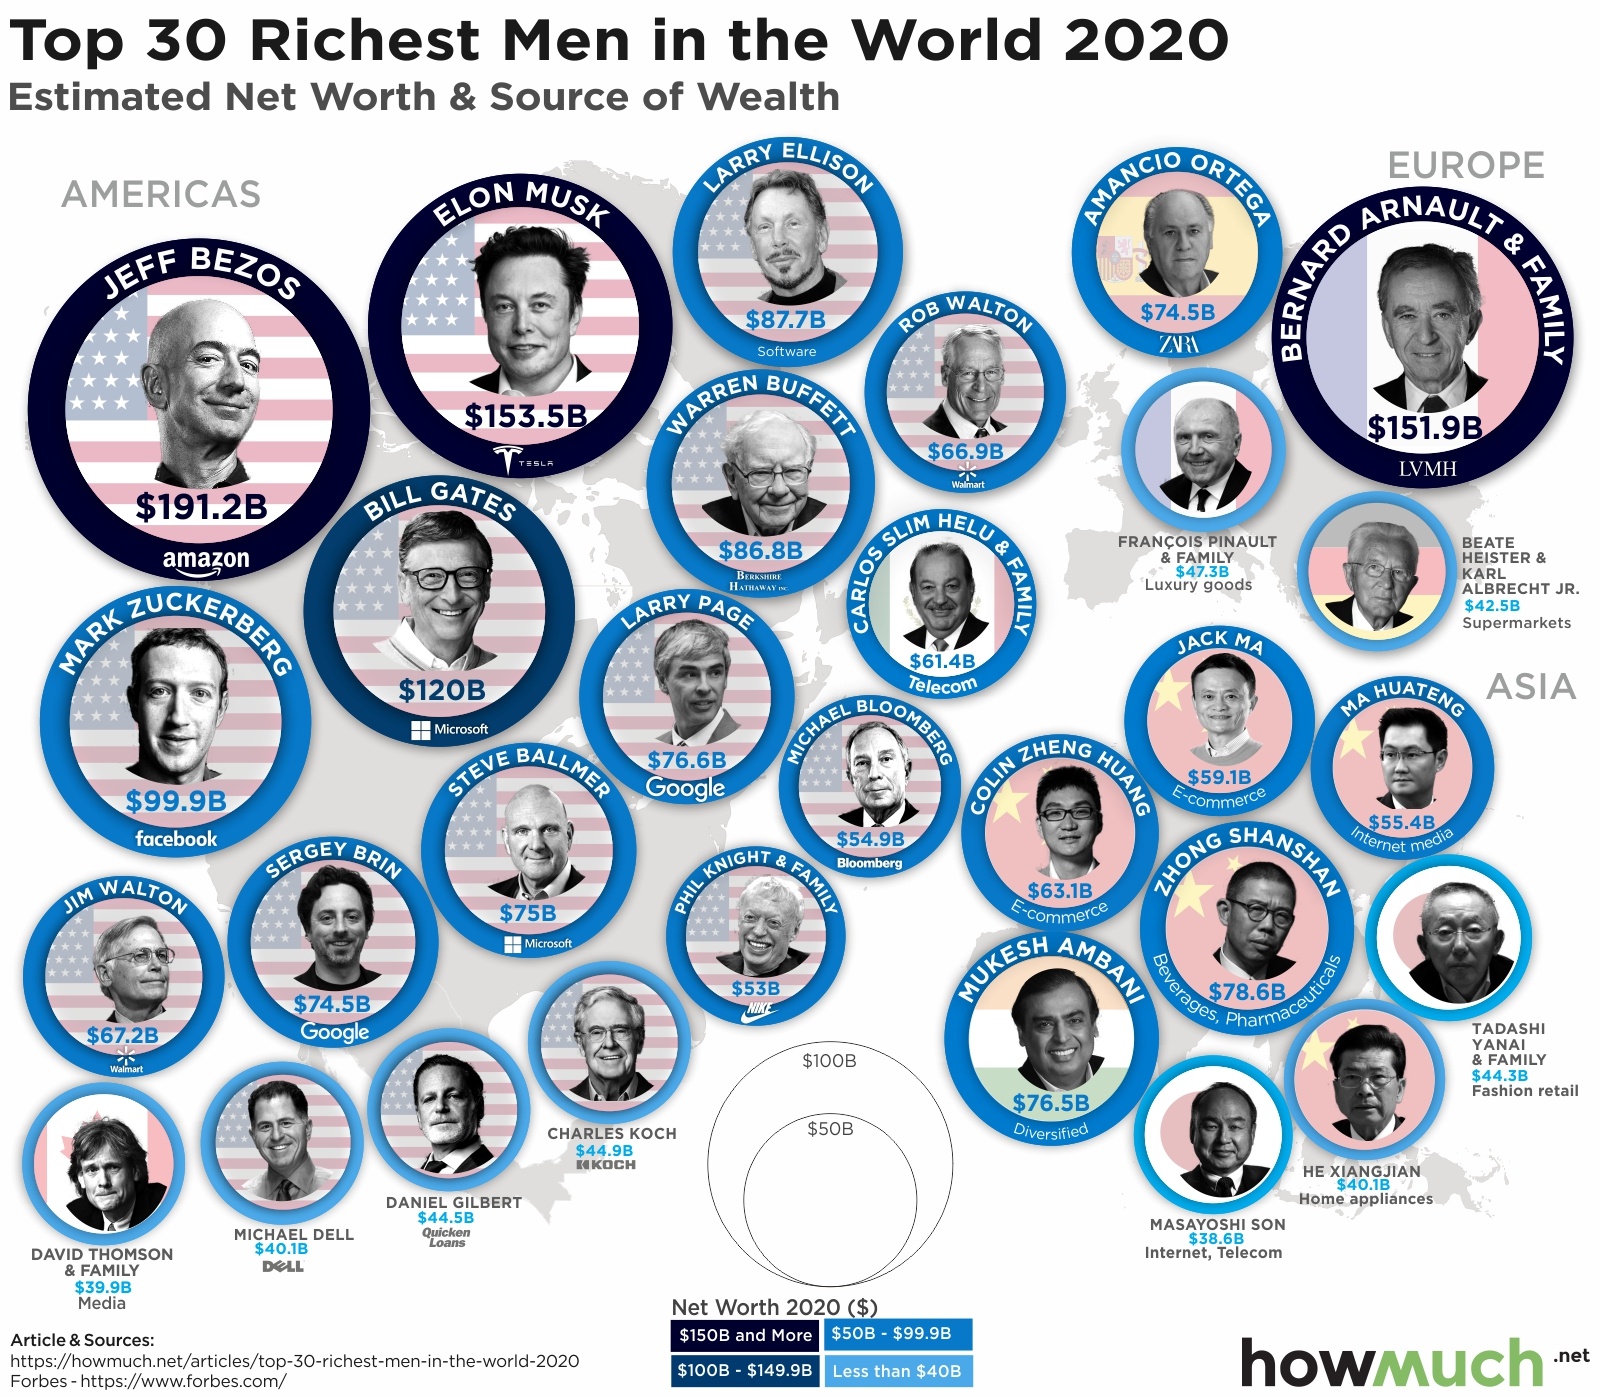
Personal Finance
business
Wealth
How much are the richest people in the world worth? This map stacks up the fortunes of the world’s 30 richest men

April 3rd, 2026
Personal Finance
business
The Economy
trade
Wealth
jobs
We pulled together our most popular visualizations of 2020 to let you know what's trending. Not surprisingly, economic issues and wealth landed at the top of our list

April 3rd, 2026
business
The Economy
trade
The rise of e-commerce isn’t a new trend. This visualization charts the 20-year rise of e-commerce in a growing retail industry