The midterm elections are right around the corner, and President Trump just announced he wants to cut middle class taxes by 10 percent. It’s obvious people don’t like paying taxes, and letting workers keep more of their paychecks could be a ploy to boost GOP turnout ahead of a pivotal election. But state tax rates vary wildly across the country, and the media’s focus on Trump’s announcement ignores a more complicated reality of taxation. In fact, our maps indicate that lots of people in a high-tax burden state might not even notice an additional tax cut.
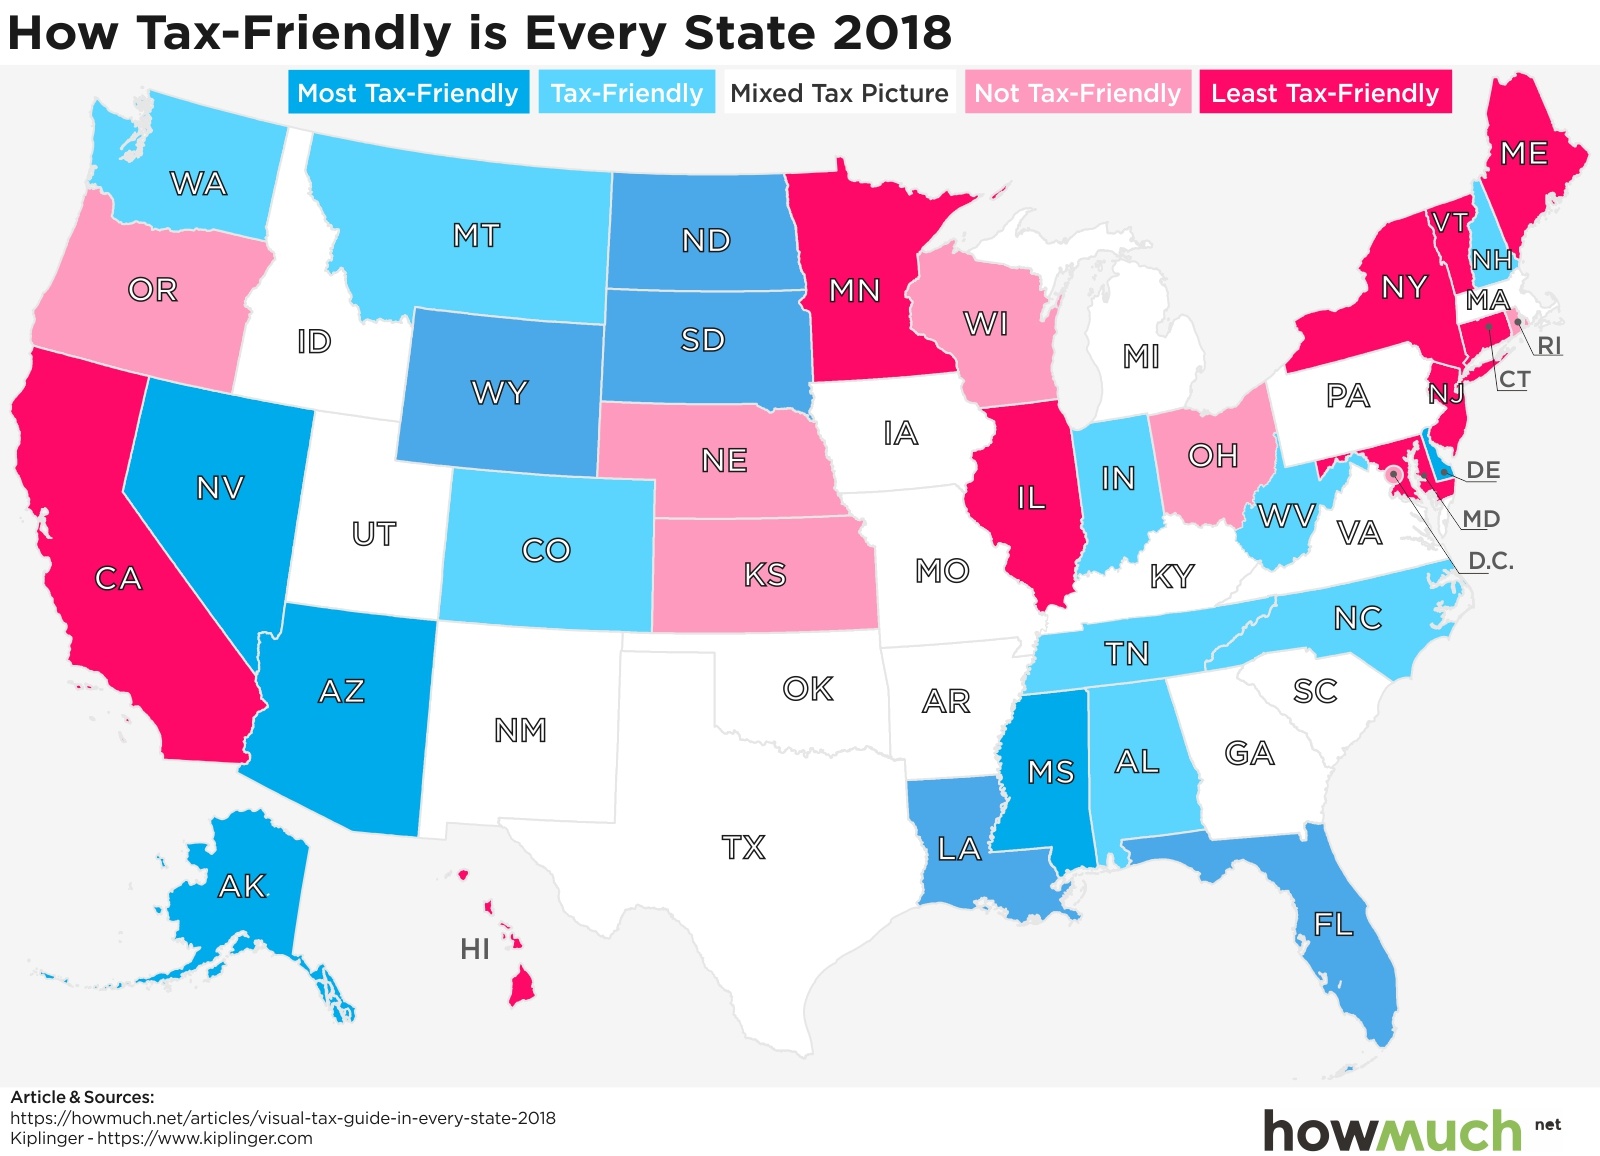
To see what we mean, let’s start by looking at which states are most and least friendly in terms of their cumulative tax burden.
Kiplinger put together all the data supporting our maps, but we will also reference additional underlying sources where appropriate. Kiplinger’s analysis of “tax friendliness” considers a few different categories of taxation, including state taxes on income, property, sales and death. We won’t dive into Kiplinger’s detailed methodology, but they put each state into one of five categories, ranging from the most to least tax friendly. And just so we are clear, the least tax friendly states have the highest cumulative total tax burdens across all of Kiplinger’s categories.
There are in fact a few key patterns worth pointing out in this overall map. There is a cluster of states in the Northeast extending to the Upper Midwest with very unfriendly tax policies. Compare these states with the South, where there’s a concentration of very tax friendly governments (or states with at least a mixed tax picture). The West is also home to a lot of tax friendly locations, with the obvious exceptions of California and Oregon. We should also mention Alaska, where the state government actually pays out a dividend to its residents instead of taxing their income. This year the government paid $1,600 to every man, woman and child, making it perhaps the state with the best fiscal policies, that is, if you can stand the winters.


One area of consumption that applies to almost everybody is the gasoline tax, which the American Petroleum Institute (API) tracks very closely. We created a heat map highlighting the range of tax levels, from under $0.20 per gallon across the South to over $0.50 in California and Pennsylvania. Remember, these figures are in addition to the federally mandated gasoline tax of $0.184 per gallon, which applies equally across the country. This means that Missouri, Alaska and Oklahoma are the only three states with levies below that of the federal government, and many states have levels more than twice as high. That’s because the federal government last raised the gasoline tax 25 years ago in 1993 and hasn’t touched it since.
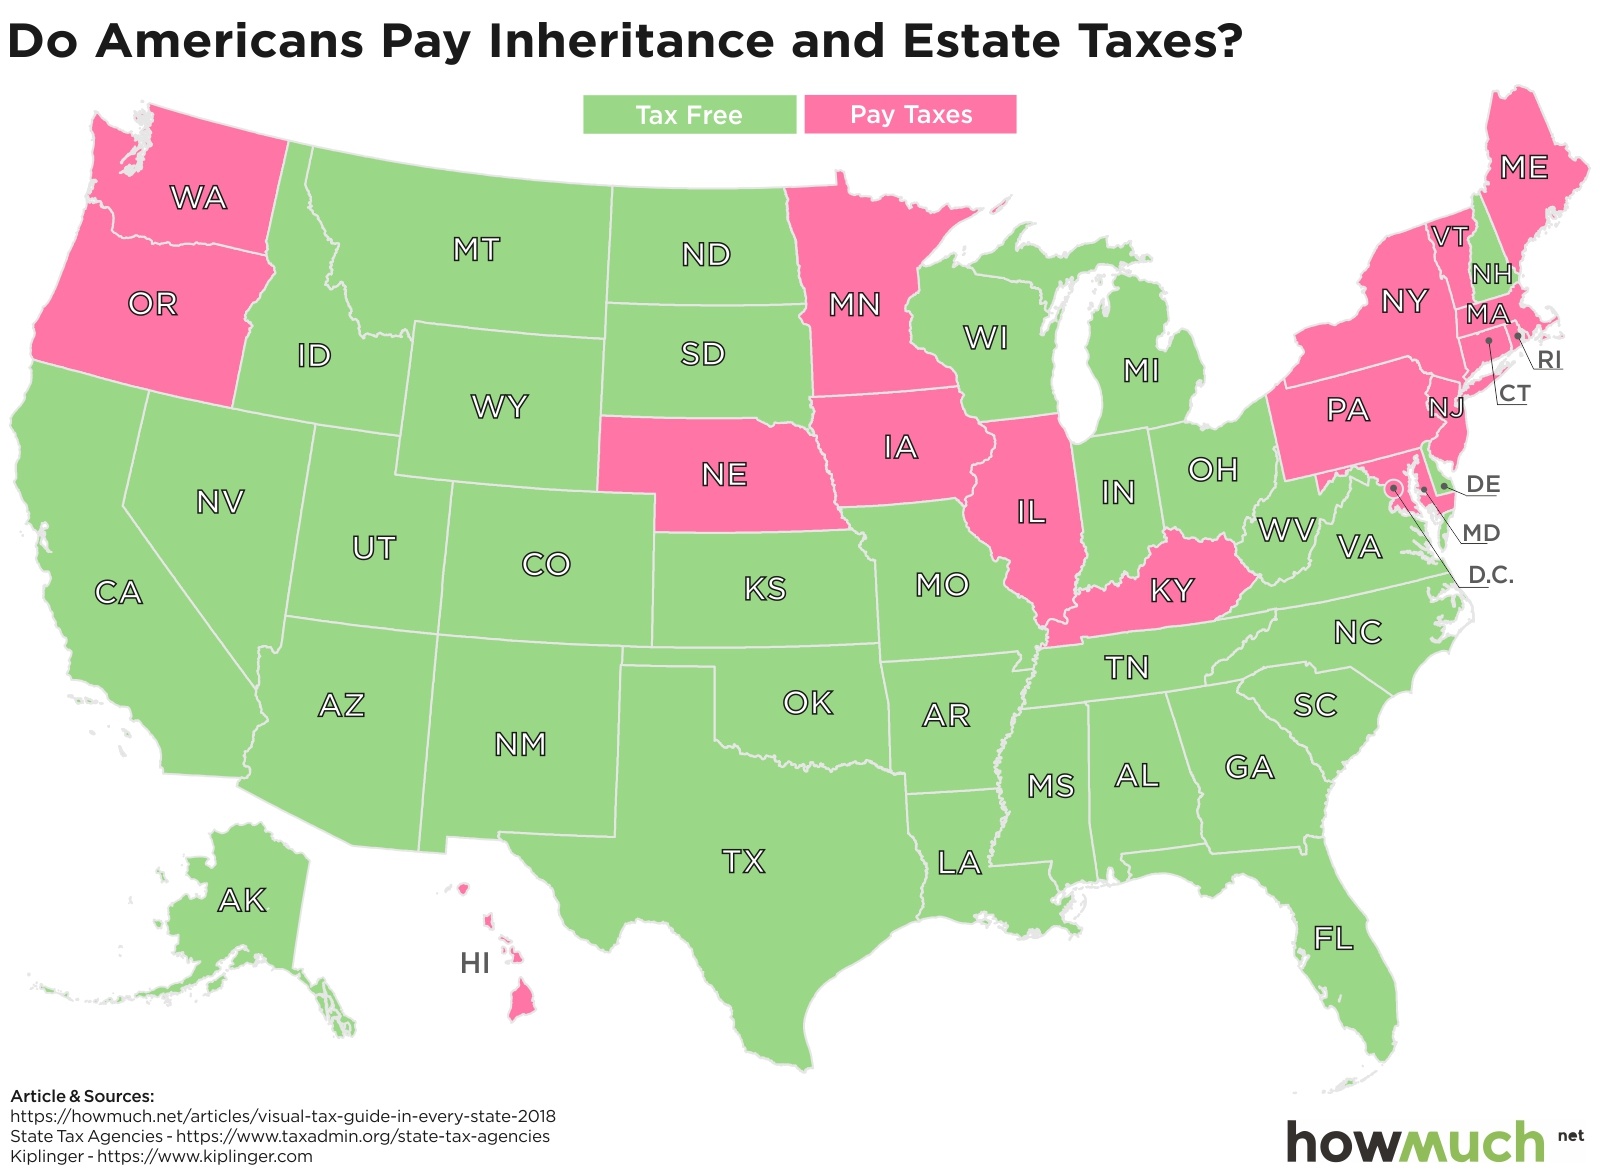
 Some taxes are easier to avoid than others. If you don’t like paying a lot for your state’s gasoline tax, then purchase a more efficient vehicle. But what if you want to shield your estate from the death tax? Our map indicates the best strategy might be to simply move south or west. No state below Kentucky has an inheritance tax, and Washington and Oregon are the only two out West with some type of “death” tax. Keep in mind that most states only tax estates worth more than an established threshold, often a very high amount. For example, in Illinois an estate must be worth $4 million or more to qualify, and even then the government applies a progressive rate.
No matter which type, taxes are a big factor in determining the cost of living in one state over another. Check out our cost of living tool to learn more.
Data: Table 1.1
About the article
Authors
Irena - Editor


