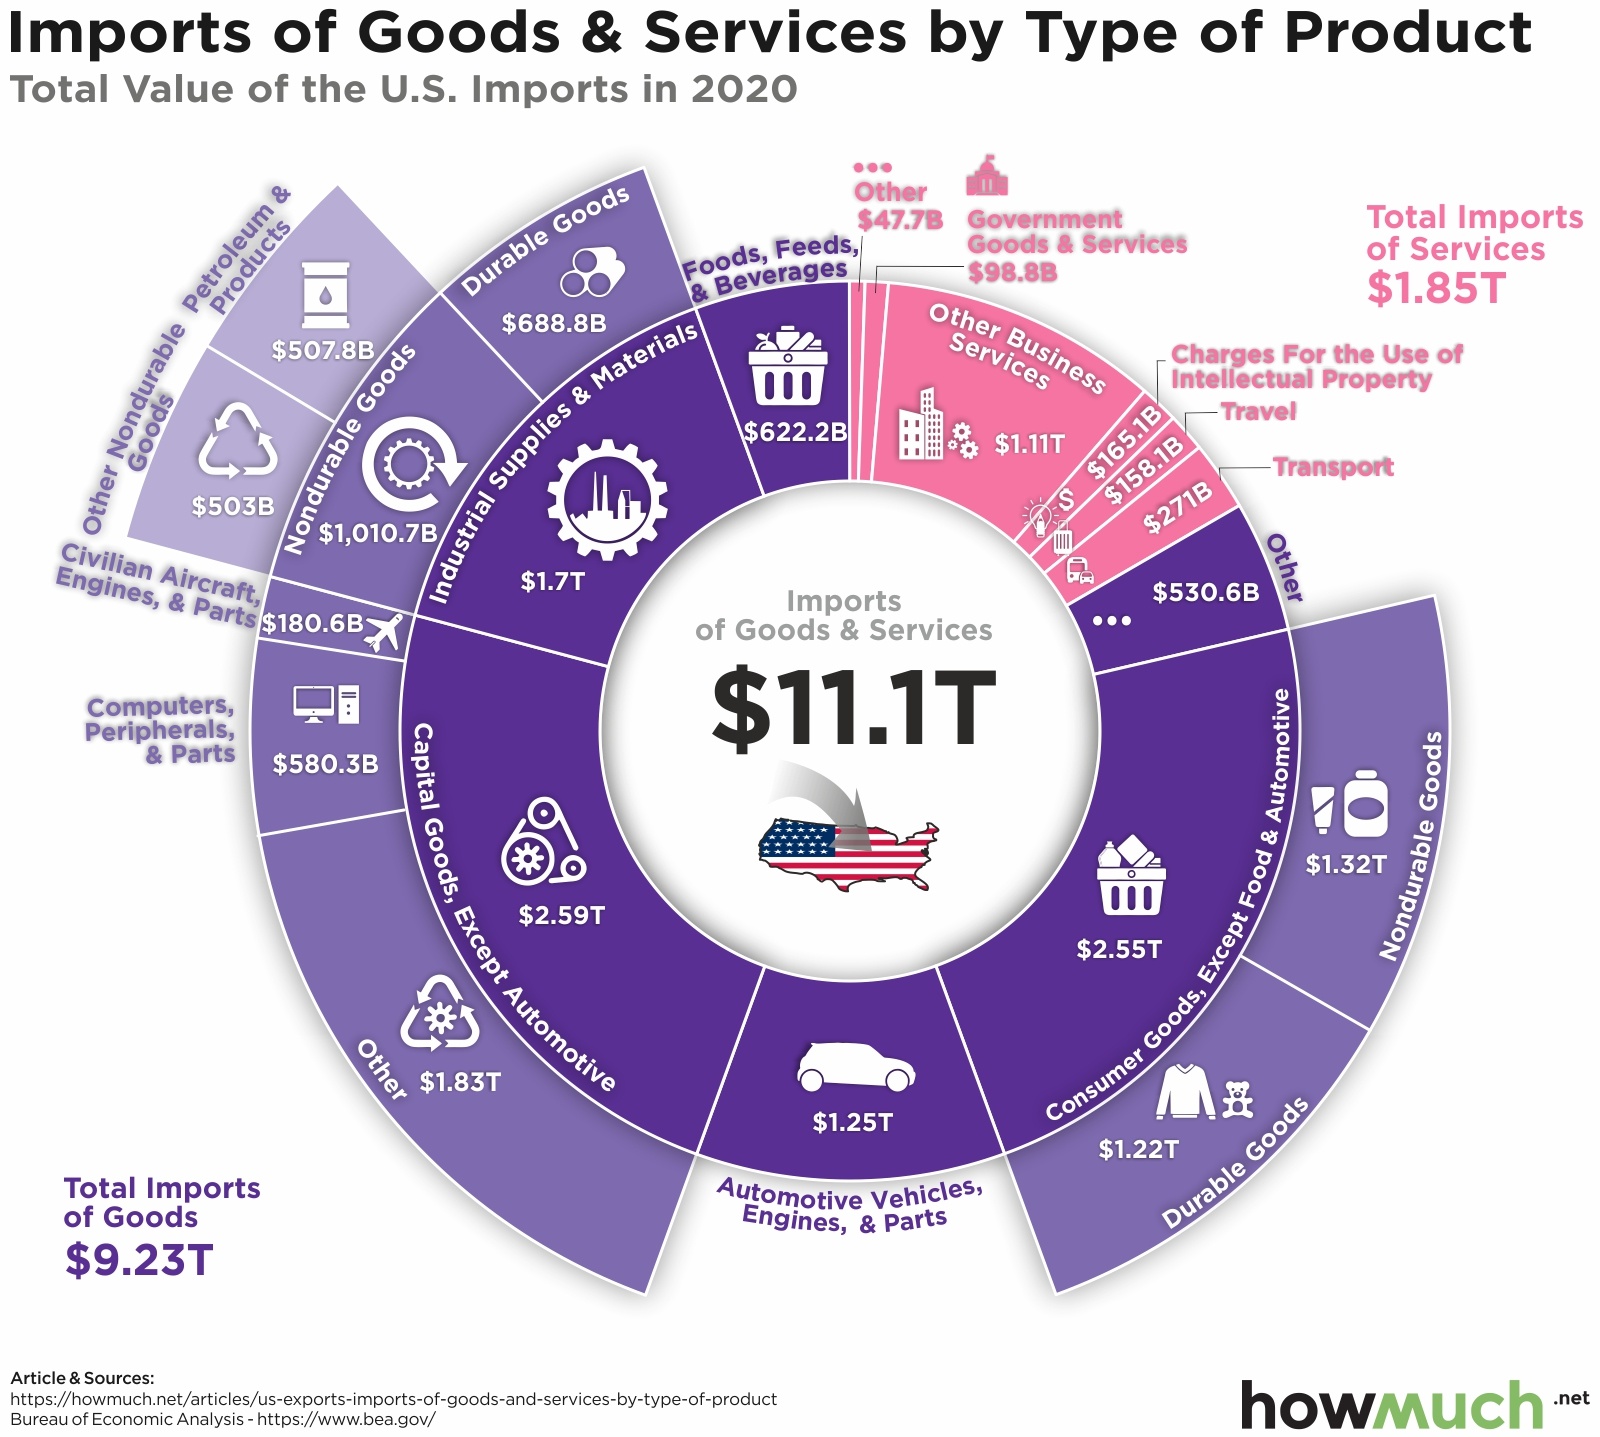
In 2020, the United States imported $11.1 trillion worth of goods and services while exporting $8.5 trillion. Breaking this down into the various product types draws a picture of the American economy. Looking at the value of the different categories, we get a sense of what products the U.S. relies heavily on other countries for, and which they produce in excess.

- America exports $2.84 trillion in services, nearly twice the $1.85 trillion it imports.
- Imports of goods stood at $9.23 trillion in 2020, nearly twice the $5.67 trillion it exports.
- The difference between imports and exports of consumer goods, except food and automotive is $1.85 trillion, the largest imbalance favoring imports.
- On the flip side, the gap between imports and exports in the other business services category came in at $570 billion favoring exports.
- Total exports dropped by $1.55 trillion and imports by $1.41 trillion in 2020 compared to 2019.
Our data comes from the U.S. Bureau of Economic Analysis. The information collected is broken down into various categories and presented in total dollars. ‘Other’ categories help capture smaller subcategories within the groups.
Top 5 U.S. Exports by Category
| Category | Export Value (2020) |
|---|---|
| 1. Capital goods, except automotive | $1.84T |
| 2. Industrial supplies and materials | $1.82T |
| 3. Consumer goods, except food and automotive | $698.9B |
| 4. Foods, feeds, and beverages | $551.4B |
| 5. Automotive vehicles, engines, and parts | $515.8B |
Top 5 U.S. Imports by Category
| Category | Import Value (2020) |
|---|---|
| 1. Capital goods, except automotive | $2.59T |
| 2. Consumer goods, except food and automotive | $2.55T |
| 3. Industrial supplies and materials | $1.70T |
| 4. Automotive vehicles, engines, and parts | $1.25T |
| 5. Foods, feeds, and beverages | $622.2B |
A quick look at the visualization might level a reader scratching their head, wondering why the U.S. imports and exports in the same category. Consider one of the top exports for the U.S. is petroleum. Differences in supply chains, types of crude oil, and refining capabilities mean that it may be cheaper to import in one part of the country and export in another. That is why, in part, Mexico and Canada are the U.S. largest export destinations.
What we can see is the heavy reliance on imports for many of the raw material products. Companies might then assemble these to sell one of America’s top exports in 2019, air and spacecraft. And, we can see how the U.S. heavily relies on imports for most consumer goods.
But we need to take this with a grain of salt. 2020 was a bit of an anomaly with the global pandemic. Economies around the globe shrank as did trade. Aircraft and engine parts exports fell by over 40% from 2019 as travel ground to a halt. As economies reemerge, these categories are likely to shift.
2021 brings a new administration in the U.S. and hope of a global recovery. So, what do you think these visuals would look like next year? Let us know in the comments.
Data: Table 1.1
About the article
Authors
Irena - Editor


