Electricity is one of the necessities of modern life. It powers our computers. It charges our phones. For some of us, it even runs our vehicles. But that convenience comes with a price tag, which is determined not just by how much we use, but also where we live.
According to the U.S. Energy Information Administration (EIA), the average U.S. household spends 12.70 cents per kWh of electricity. Using recent data from the EIA, we created three heat maps to illustrate how electricity rates vary across the U.S and across different types of customers. The first map is for residential electricity, which is electricity used in a house. The second is commercial electricity, which is used by businesses like retail establishments or private corporations. The third is for industrial electricity, which is for large manufacturing plants and production facilities. On each map, the darker shades indicate a more expensive electricity rate (measured as cents/kWh) and lighter shades indicate a less expensive rate.
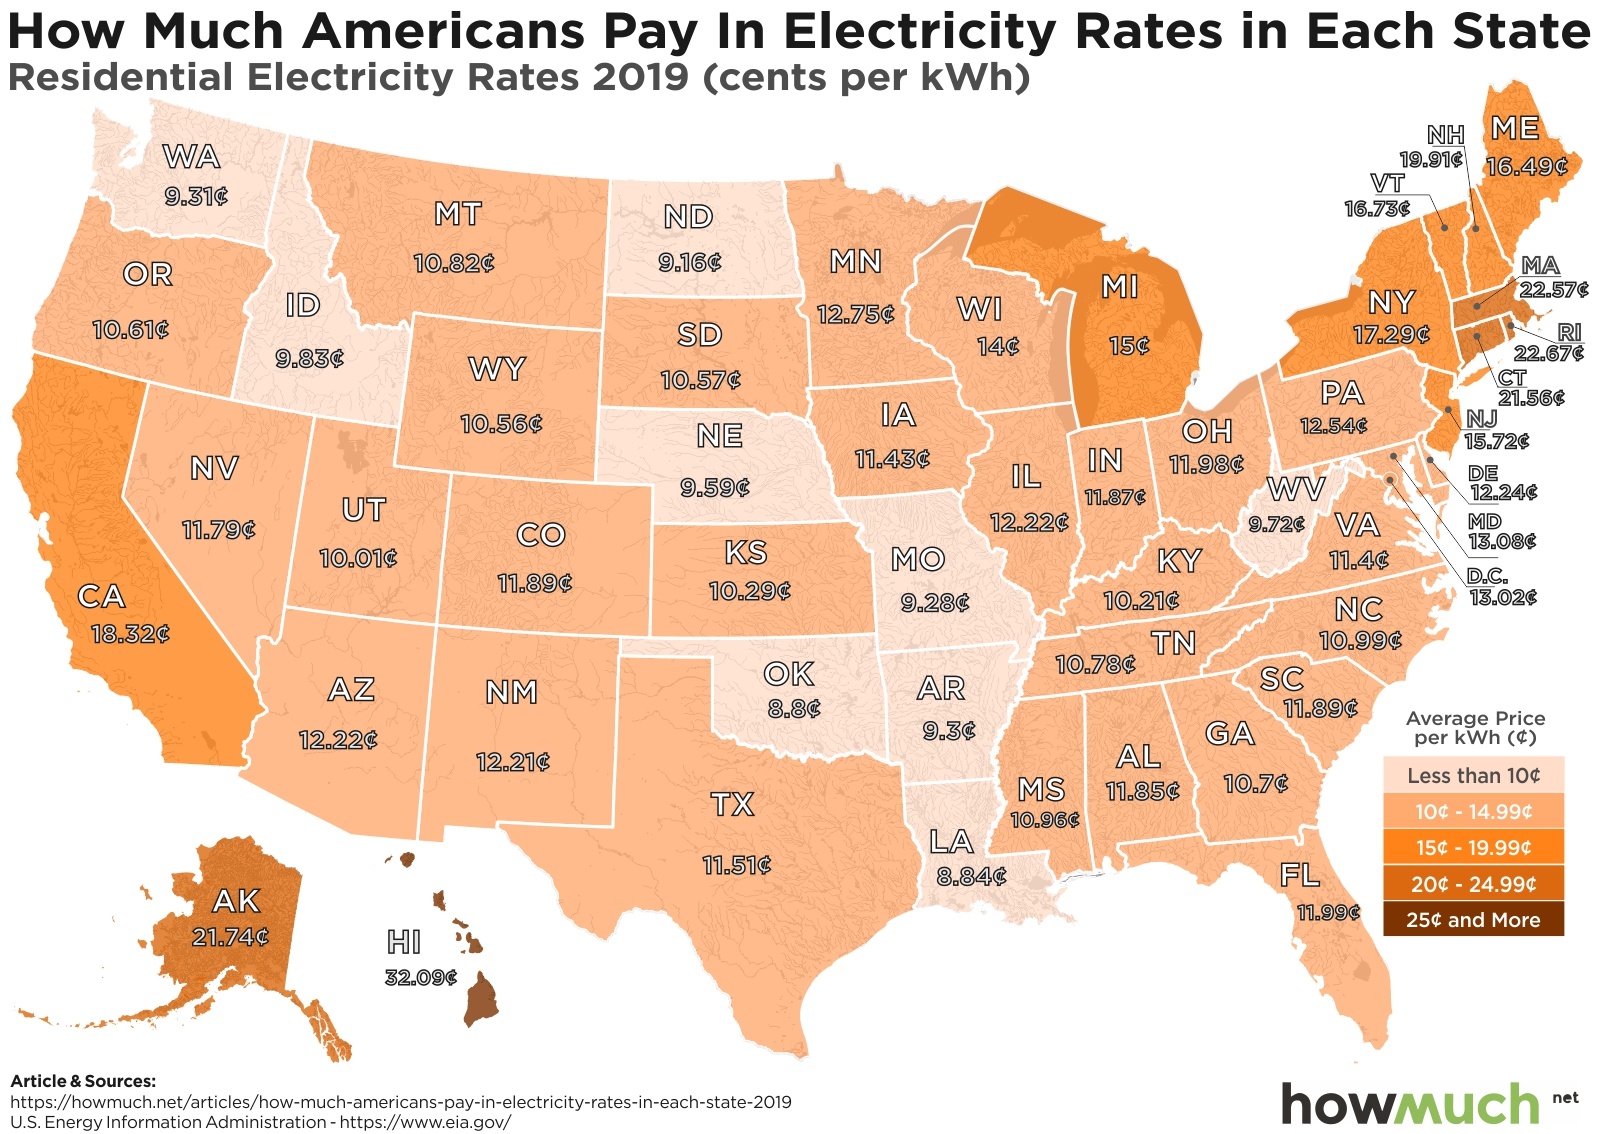
Most Expensive Residential Electricity Rates by State (cents/kWh)
1. Hawaii: 32.09
2. Rhode Island: 22.67
3. Massachusetts: 22.57
4. Alaska: 21.74
5. Connecticut: 21.56

Most Expensive Commercial Electricity Rates by State (cents/kWh)
1. Hawaii: 30.64
2. Alaska: 19.28
3. Rhode Island: 18.39
4. Connecticut: 17.44
5. Massachusetts: 17.02

Most Expensive Industrial Electricity Rates by State (cents/kWh)
1. Hawaii: 26.73
2. Massachusetts: 17.12
3. Alaska: 16.91
4. Rhode Island: 14.74
5. Connecticut: 14.51
There are a number of interesting findings. Across all types of buildings, Hawaii has the most expensive electricity rates. Alaska is also one of the most expensive states for electricity, due in part to its geographic isolation from the rest of the U.S.
In the contiguous states, the Northeast commands higher energy prices, while the Midwest, South, and Northwest tend to have comparatively lower rates. A major reason for this is because the Northeast is so densely populated that energy demand is very high; the same is true for California, which also has higher electricity prices.
By contrast, more rural states like Oklahoma and Louisiana have some of the lowest electricity rates. Notably, electricity is derived from other energy sources like coal, gas, wind, hydro, or solar power. The local availability of these resources, as well as their operating costs, will also play a role in determining prices. This explains why more resource-rich states or more sparsely populated states that have room for energy plants charge less for electricity.
So how do these rankings stack up against 2018? View last year’s visualization here.
Data: Table 1.1
About the article
Authors
Irena - Editor


