Apple is easily the most valuable company in the world. Its stock has been on a relentless upward march for the last two years straight, and the latest earnings report brings more of the same good news for shareholders. If the company’s share price increases just $4.00 more, Apple will easily become the first company worth more than $1 trillion. That’s insane, but how does it compare with the most valuable companies from every other country? The results aren’t even close.
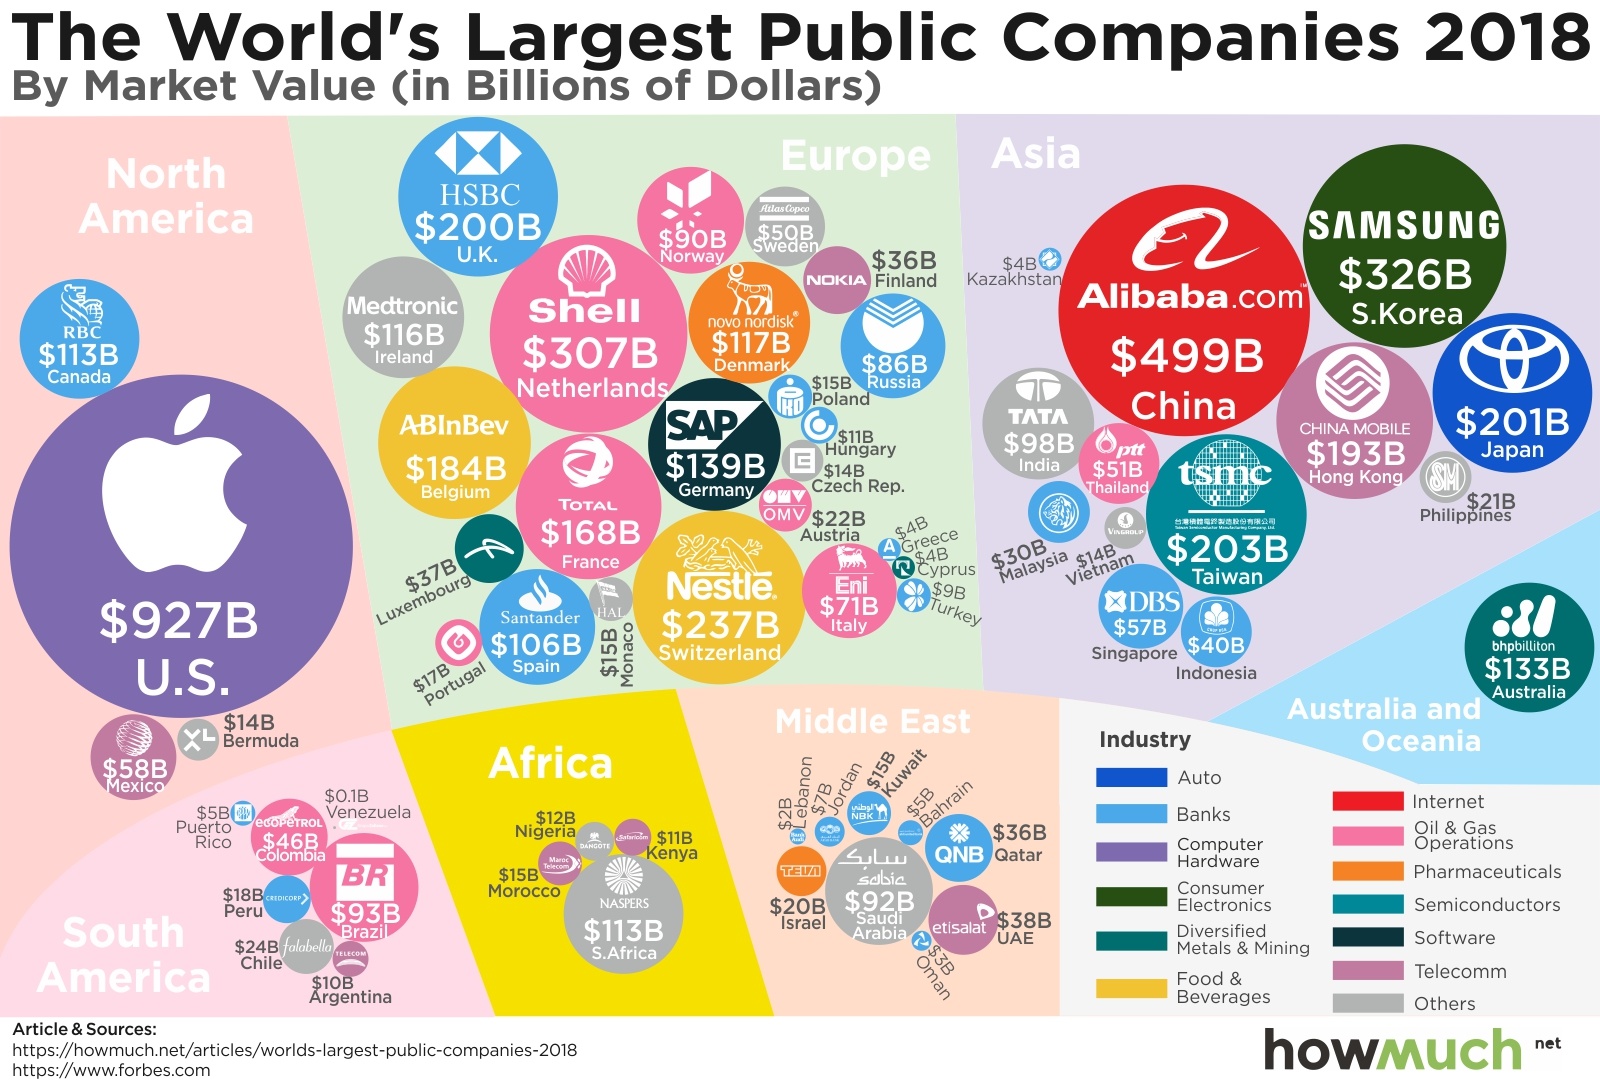 We gathered the data for our visualization from Forbes, which we used to identify the largest company headquartered in each country. We represented each company with a bubble sized corresponding to its market value. We added the market cap ($B) as well as a logo for easy reference and a color-coded legend for each company’s industry. Grouping the bubbles by continent gives a unique view of the world economy.
Remember, our data only include one company from each country, which is why household names like Walmart and Google are missing. The result is an interesting comparison of the most dominant public companies around the world.
Top 10 Most Valuable Public Companies
1. Apple (United States): $926.9B in value and $53.3B in profits
2. Alibaba (China): $499.4B in value and $9.6B in profits
3. Samsung Electronics (South Korea): $325.9B in value and $41B in profits
4. Royal Dutch Shell (Netherlands): $306.5B in value and $15.2B in profits
5. Nestle (Switzerland): $237.3B in value and $7.3B in profits
6. Taiwan Semiconductor (Taiwan): $203B in value and $11.5B in profits
7. Toyota Motor (Japan): $200.7B in value and $22.5B in profits
8. HSBC Holdings (United Kingdom): $200.3B in value and $10.8B in profits
9. China Mobile (Hong Kong): $192.6B in value and $16.9B in profits
10. Anheuser-Busch InBev (Belgium): $184.3B in value and $7.9B in profits
For starters, our visualization demonstrates how much more valuable corporations are in the Northern Hemisphere are than in the Southern. Apple, Shell, Alibaba, Samsung—the largest bubbles in the visual are all located in the upper half, not the global South. Well on its way to becoming the first American trillion-dollar company, Apple is by itself many times bigger than the combination of all the companies in South America, Africa, the Middle East, and Australia and Oceania! Apple’s market value is truly impressive.
Looking at the companies listed within each continent is also revealing for two reasons. First, there are a few noticeable industries that tend to top the charts. There are several banks in our visualization—17 to be exact, far more than any other sector. Oil and gas companies are the second-most common, followed by telecommunications. Otherwise, our visual demonstrates the breadth of diverse sectors in the world’s economies.
And second, Europe and Asia have so many $100B+ companies compared to only one between South America, Africa, and the Middle East (Naspers at $113B). Keep in mind there are significantly more countries in Africa than any other continent, but only a handful are represented here. In other words, our visualization highlights the disparity and inequality between the world’s economies. And speaking of inequality, check out our new iPhone index to see how Apple’s products can be used to benchmark living expenses around the world.
About the article
Authors
Irena - Editor


