The U.S. stock market is booming, the labor market is extremely tight and wages are finally starting to rise. And yet wealth inequality remains at a five-decade high as the top 1% just keep getting richer. Take the founder and CEO of Amazon, Jeff Bezos, who is reportedly worth some $103.9 billion. Such an eye-popping number got us thinking about wealth inequality across the country for ordinary workers.
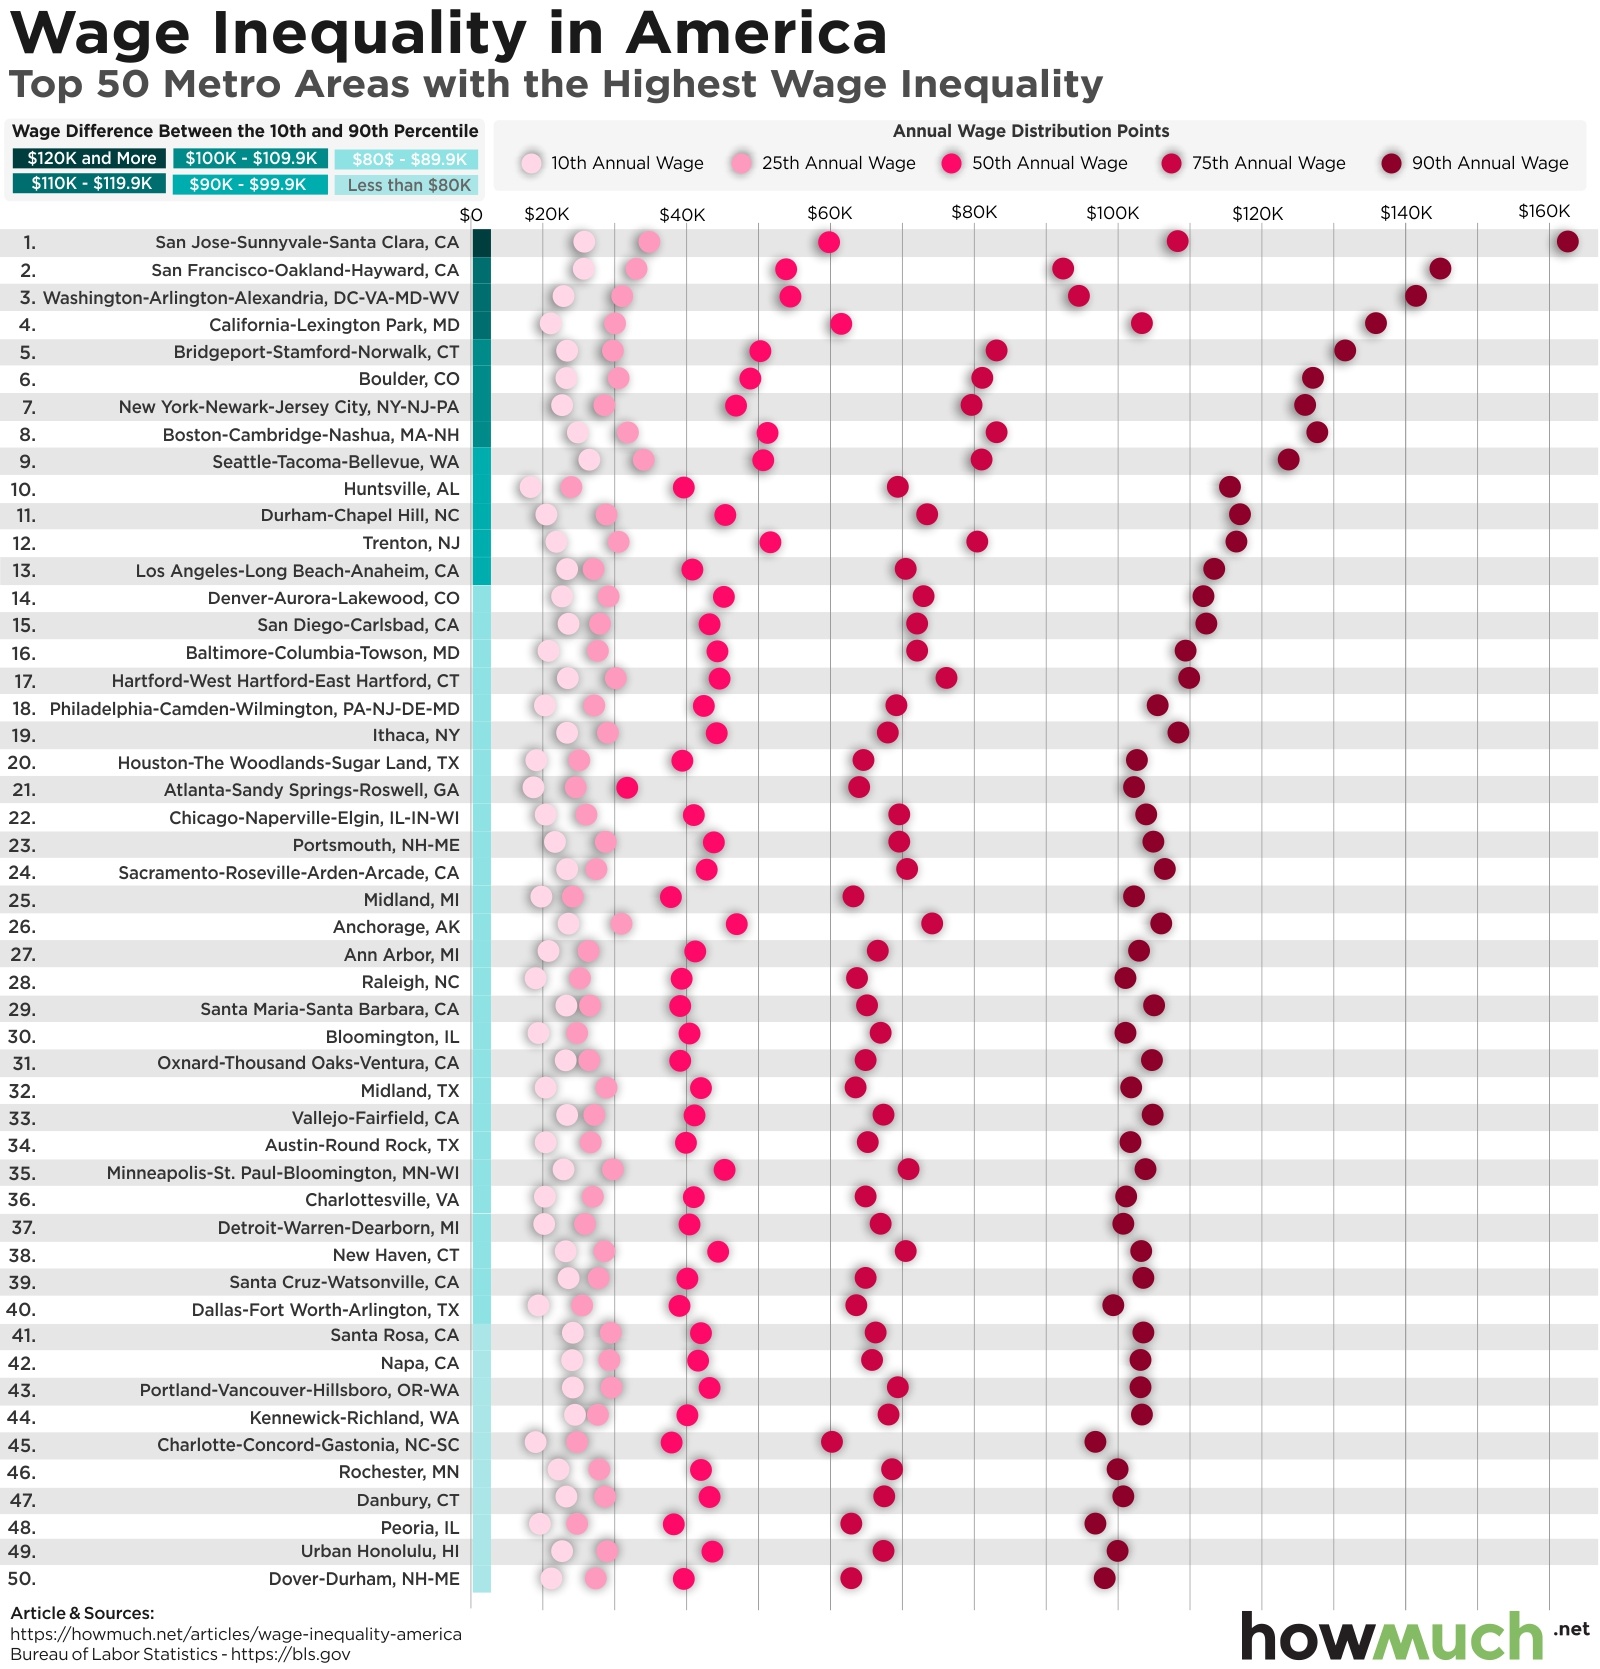
- San Jose, CA has the highest rate of wage inequality. The top 90th percentile take home $137,390 more than someone in the 10th percentile.
- The average wage gap in our visual between the 10th and 90th percentiles is $88,480.
- There is a clear group of cities where inequality has reached extreme heights, however it remains significant even in places like Peoria, IL.
- Workers in the 10th percentile do not have a similar distribution of income. Low-wage workers make about the same no matter where they live, always below $27,000.
We built our visualization with numbers from the U.S. Bureau of Labor Statistics for 2018, focusing on the top 50 metro areas with the greatest rates of inequality in the country. We ranked each city based on the size of the gap between earners in the 10th and 90th percentiles. We also included figures for the 25th, 50th and 75th percentiles for easy reference. This lets you quickly see which parts of the country have the highest levels of inequality.
Top 10 Metros for Wage Inequality ($ dif. between 10th and 90th percentiles)
1. San Jose-Sunnyvale-Santa Clara, CA: $137,390
2. San Francisco-Oakland-Hayward, CA: $119,640
3. Washington-Arlington-Alexandria, DC-VA-MD-WV: $119,020
4. California-Lexington Park, MD: $115,300
5. Bridgeport-Stamford-Norwalk, CT: $108,700
6. Boulder, CO: $104,290
7. New York-Newark-Jersey City, NY-NJ-PA: $103,790
8. Boston-Cambridge-Nashua, MA-NH: $103,300
9. Seattle-Tacoma-Bellevue, WA: $97,690
10. Huntsville, AL: $97,630
Our visual reveals several key trends about wealth inequality in the U.S. For starters, inequality is severe all across the country. San Jose sits at the absolute extreme end of the spectrum, where the top 90th wage earners rake in $137,390 more than someone in the 10th percentile. San Francisco is not far behind with a gap of $119,640. Clearly Silicon Valley has extraordinary amounts of inequality.
That being said, our visual demonstrates how there’s only a slight drop off in equality across the South and Midwest. In places like Dover-Durham, Honolulu and Peoria, the top earners are still making $75,000 more than workers at the bottom of the income ladder. In fact, for mid-sized cities, the 90th percentile clusters just over $100,000 in total income.
Perhaps the most interesting revelation in our visual is how there isn’t a comparable curve for low-wage workers. Someone in the 10th percentile in San Jose makes about as much money as someone in the 10th percentile in Portland. In other words, we don’t see low-wage earners making more money in places with extremely high wage earners, They no doubt have a higher cost of living, meaning their wages don’t go nearly as far. Policymakers will have to do a lot more than raise the minimum wage to $15 to actually change these figures.
What do you think the greatest drivers of inequality are in the U.S. today? With the economy continuing to grow, do you think the situation will start to improve? Let us know in the comments.
Data: Table 1.1
About the article
Authors
Irena - Editor


