Tip!
Rate data in this report is drawn from KFF/Peterson-KFF Health System Tracker's analysis of insurer rate filings across all 50 states and DC for plan year 2026, plus KFF's premium tax credit expiration modeling. Figures current as of publish date.
If you get your health insurance through the ACA Marketplace (sometimes called "Obamacare" or "healthcare.gov"), you're probably going to open your renewal notice this year and feel a little sick. There are two things going on, and it's worth understanding both, because they hit you in different ways.
First: insurance companies are raising their prices almost everywhere. That's normal, it happens every year, though this year's increases are bigger than usual.
Second, and this is the big one: the extra discount the government has been giving most Marketplace shoppers since 2021 just expired. If you've been paying, say, $150 a month for a plan that actually costs $500, that gap has been covered by a subsidy. For a lot of people, that subsidy just shrank or disappeared. So even if your plan's actual price didn't change much, your bill might jump a lot.
That second thing is why this year is different, and it's the part most people don't see coming.
The short version
-
Insurance companies are charging more this year pretty much everywhere. Nationally, prices are up by about a fifth to a quarter on average, though it varies a lot by state.
-
The bigger issue: extra government help that's been lowering people's bills since 2021 ran out at the end of 2025. Without it, what people actually pay is projected to jump by 114% on average, more than double, adding up to roughly $1,016 more per year.
-
In 46 states and DC, a 60-year-old who was getting some of that extra help will see their yearly bill at least double.
-
The size of the hit depends a lot on your age and where you live. Older shoppers and people in pricier insurance markets are going to feel this the most.
Wait, what's actually going on here? what content is next?
Let's back up for a second, because the jargon in insurance is genuinely confusing.
A "premium" is just your monthly bill. A "subsidy" or "premium tax credit" is money the government kicks in to lower that bill for people who qualify, usually based on your income. Since 2021, those subsidies got a lot more generous, which is a big reason Marketplace plans became so much more affordable for so many people over the past few years.
That extra generosity was always meant to be temporary, and it expired at the end of 2025. Nobody extended it. So starting with 2026 coverage, the subsidy math went back to being less generous, or in some cases, disappeared for people who are now considered too high-income to qualify at all.
Here's the part that trips people up: your plan's sticker price and the discount you get are two completely separate things. Your insurance company can raise prices a little and you could still see a huge jump in your bill, because the discount that used to cover most of the increase isn't there anymore.
How much more are insurance companies charging where you live?
Setting the subsidy issue aside for a second, just look at what insurance companies themselves are charging more for coverage this year. It varies a lot depending on your state. Find yours below.
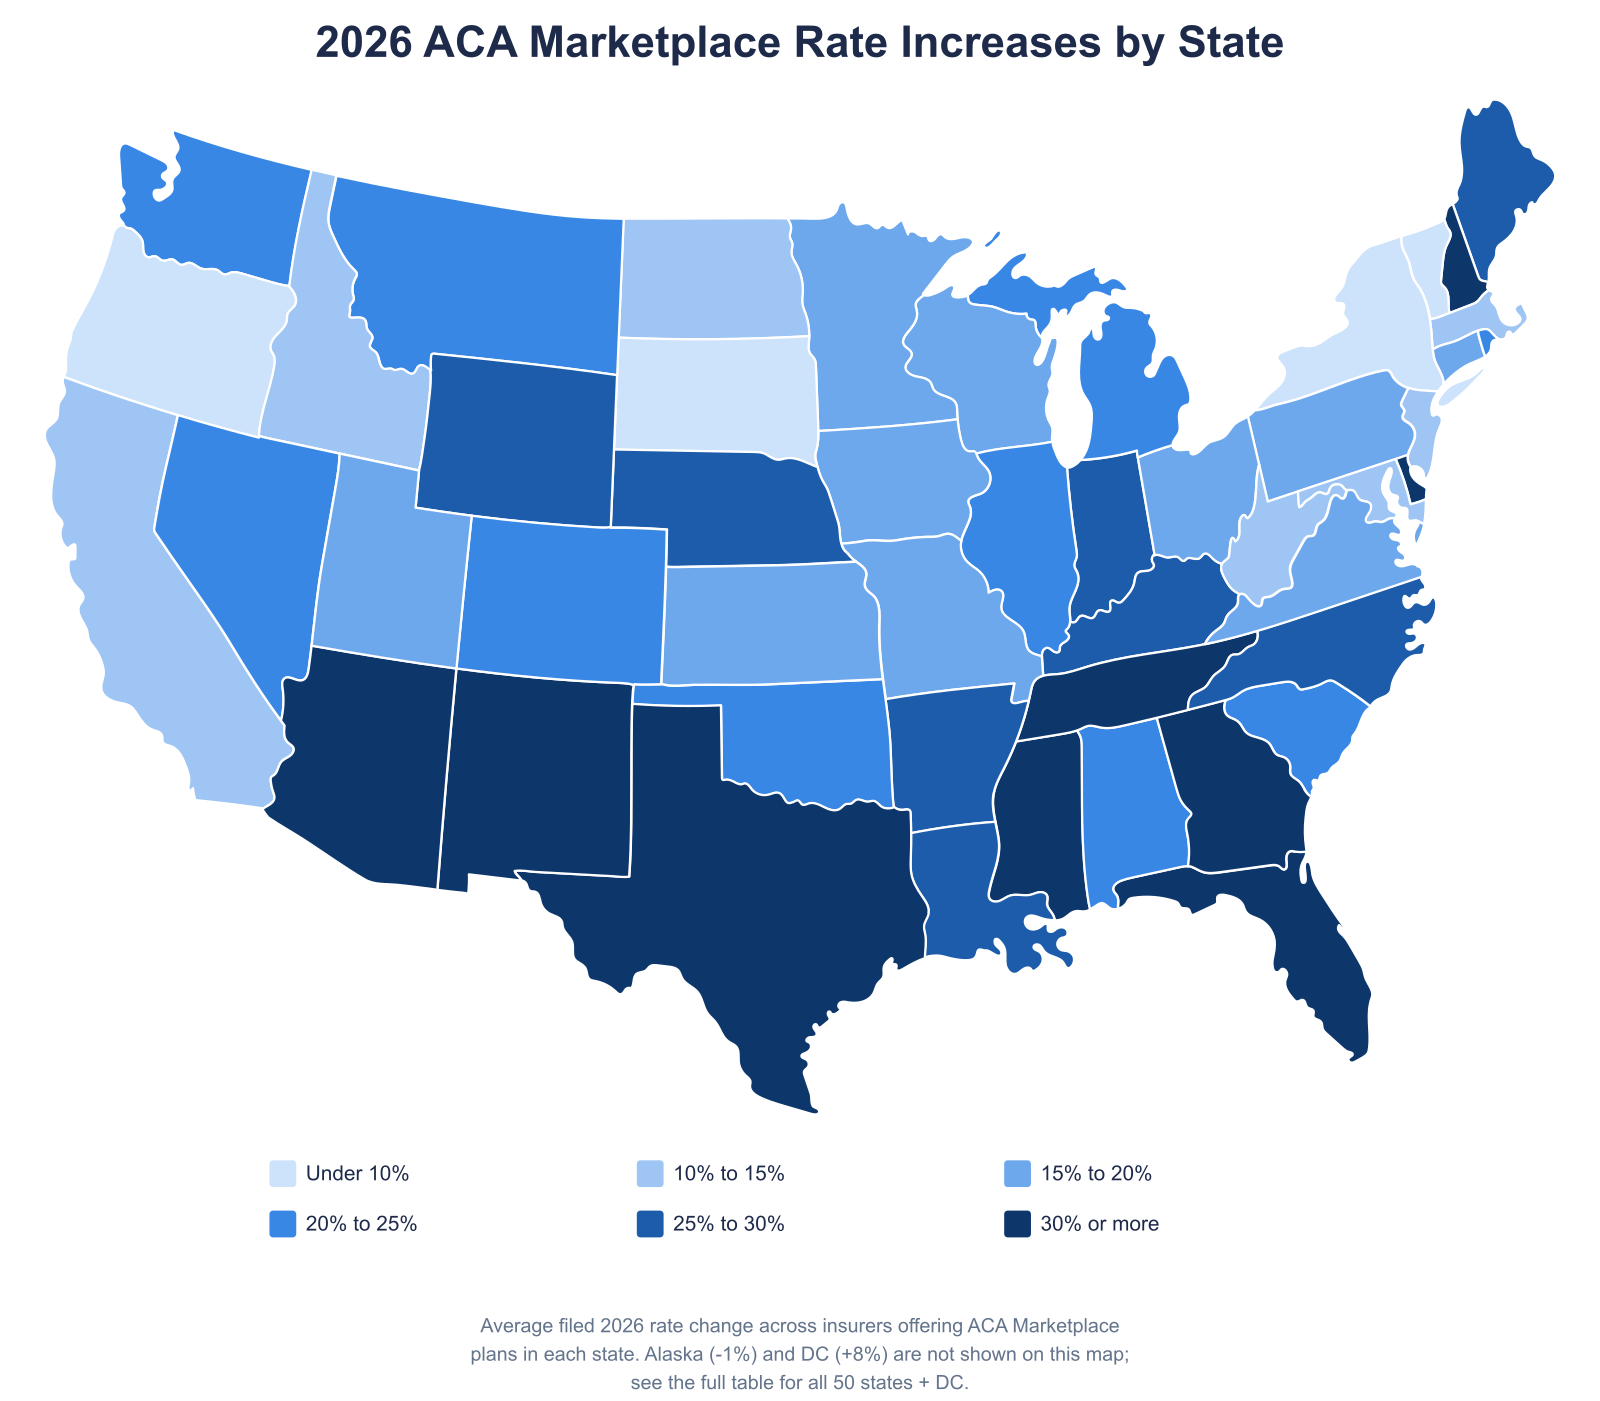
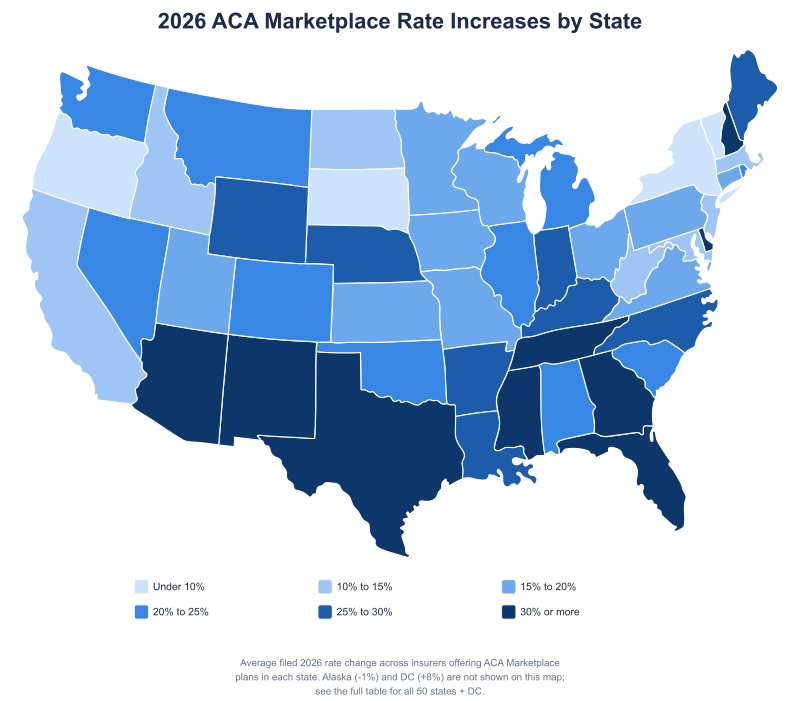
Your State | Avg. Price Increase | Low End | High End |
Mississippi | 42% | 33% | 60% |
Arizona | 34% | 18% | 49% |
New Mexico | 34% | 15% | 52% |
Florida | 33% | 19% | 52% |
Tennessee | 33% | 11% | 42% |
Georgia | 32% | 17% | 40% |
Delaware | 31% | 27% | 35% |
Texas | 31% | 16% | 43% |
New Hampshire | 30% | 19% | 43% |
Indiana | 28% | 23% | 30% |
North Carolina | 28% | 17% | 37% |
Wyoming | 28% | 25% | 30% |
Nebraska | 27% | 20% | 37% |
Maine | 26% | 21% | 33% |
Arkansas | 26% | 12% | 42% |
Louisiana | 26% | 23% | 33% |
Kentucky | 26% | 16% | 37% |
Nevada | 23% | 14% | 31% |
Illinois | 22% | 10% | 42% |
South Carolina | 22% | 18% | 25% |
Alabama | 22% | 20% | 25% |
Colorado | 21% | 14% | 33% |
Washington | 21% | 8% | 39% |
Rhode Island | 21% | 21% | 22% |
Montana | 21% | 11% | 25% |
Oklahoma | 21% | 8% | 33% |
Michigan | 20% | 9% | 26% |
Iowa | 20% | 13% | 27% |
Ohio | 20% | 4% | 37% |
Minnesota | 20% | 7% | 31% |
Pennsylvania | 18% | -10% | 39% |
Connecticut | 18% | 14% | 21% |
Utah | 18% | 13% | 32% |
Missouri | 17% | -4% | 30% |
Virginia | 17% | 1% | 35% |
Kansas | 17% | -6% | 34% |
Wisconsin | 17% | 7% | 35% |
New Jersey | 15% | 5% | 19% |
California | 13% | 7% | 20% |
Maryland | 12% | 10% | 15% |
North Dakota | 12% | 5% | 23% |
Idaho | 12% | 8% | 16% |
Hawaii | 11% | 10% | 12% |
Massachusetts | 11% | 7% | 16% |
West Virginia | 11% | 8% | 13% |
Oregon | 10% | 4% | 13% |
New York | 9% | -9% | 21% |
Washington, D.C. | 8% | 4% | 10% |
Vermont | 5% | 1% | 10% |
South Dakota | 5% | 2% | 9% |
Alaska | -1% | -3% | 1% |