
April 3rd, 2026
The Economy
trade
Agriculture is a cornerstone of the U.S. economy. But the types of agricultural products cultivated in each state are different, and some states are greater agricultural powerhouses than others.

April 3rd, 2026
Personal Finance
Beer is a popular beverage all around the world. But how much will a pint set you back in different cities?

April 3rd, 2026
Personal Finance
social-issues
How much money do you need to make to be considered at risk of poverty? In some countries, the threshold is higher than you might think

April 3rd, 2026
Personal Finance
taxes
Wealth
As the April 15 deadline rapidly approaches, taxes are on national mind. Even though everyone’s tax situation is unique, there are a number of taxation trends at the state level which suggest that not everyone is paying their fair share

April 3rd, 2026
The Economy
As issues of climate change, sustainable energy, and the Green New Deal dominate the news cycle, our latest data visualization shows which countries have the biggest reserves of one of the world’s most-used energy sources, crude oil
April 3rd, 2026
The Economy
debt
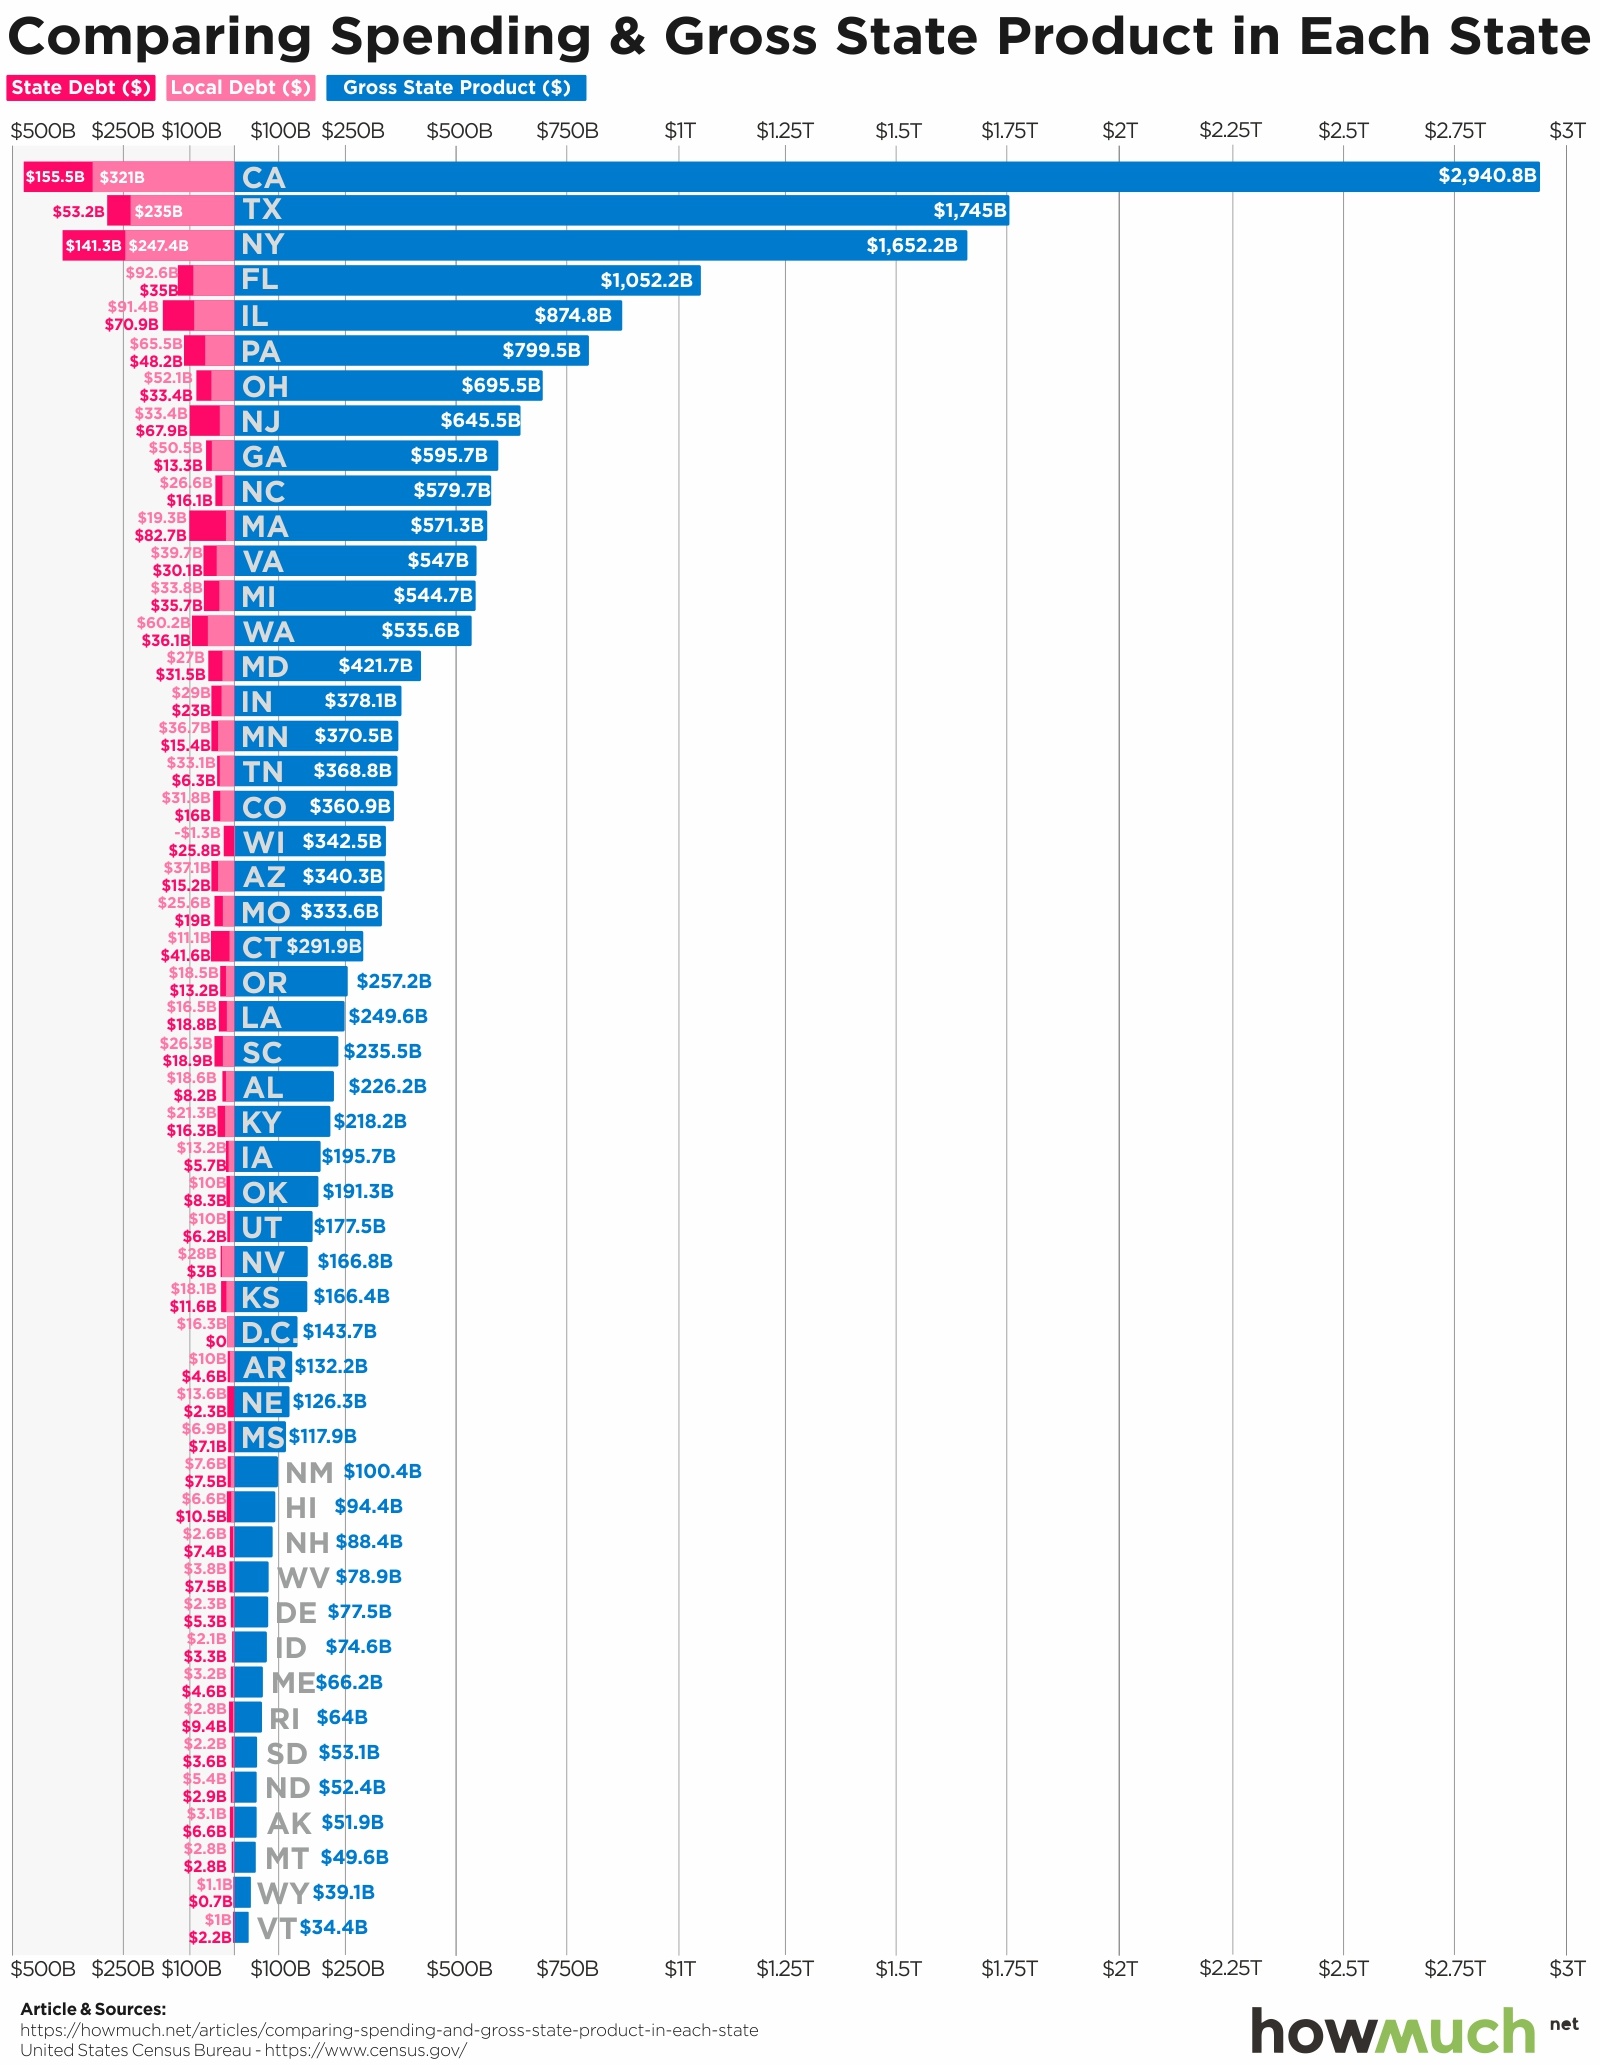
Our latest visualization uses data from the U.S. Census Bureau to compare each U.S. state’s debt to its output

April 3rd, 2026
Personal Finance
jobs
This graphic shows the mean yearly income of financial advisors in all 50 states. Their average salaries range between just over $76K in Vermont to more than $166K in New York

April 3rd, 2026
Personal Finance
Where you live (and drive) has a huge impact on how much you pay for auto insurance. Our newest visualization breaks down average annual car insurance premiums by state and how some parts of the country are much more expensive for drivers than others

April 3rd, 2026
The Economy
The economies of these nations fit like puzzle pieces inside this map of America.

April 3rd, 2026
business
Are U.S. banks too big to fail? And how many “big banks” are there really? Our visualization lets you easily compare the size of different banks according to the value of their assets.