
April 3rd, 2026
Personal Finance
The Economy
social-issues
monetary-policy
Electric cars are good for the environment, but they can be bad for your budget. This map breaks down how much it costs and how popular it is to own an electric vehicle.
April 3rd, 2026
The Economy
social-issues
monetary-policy
Wealth
jobs
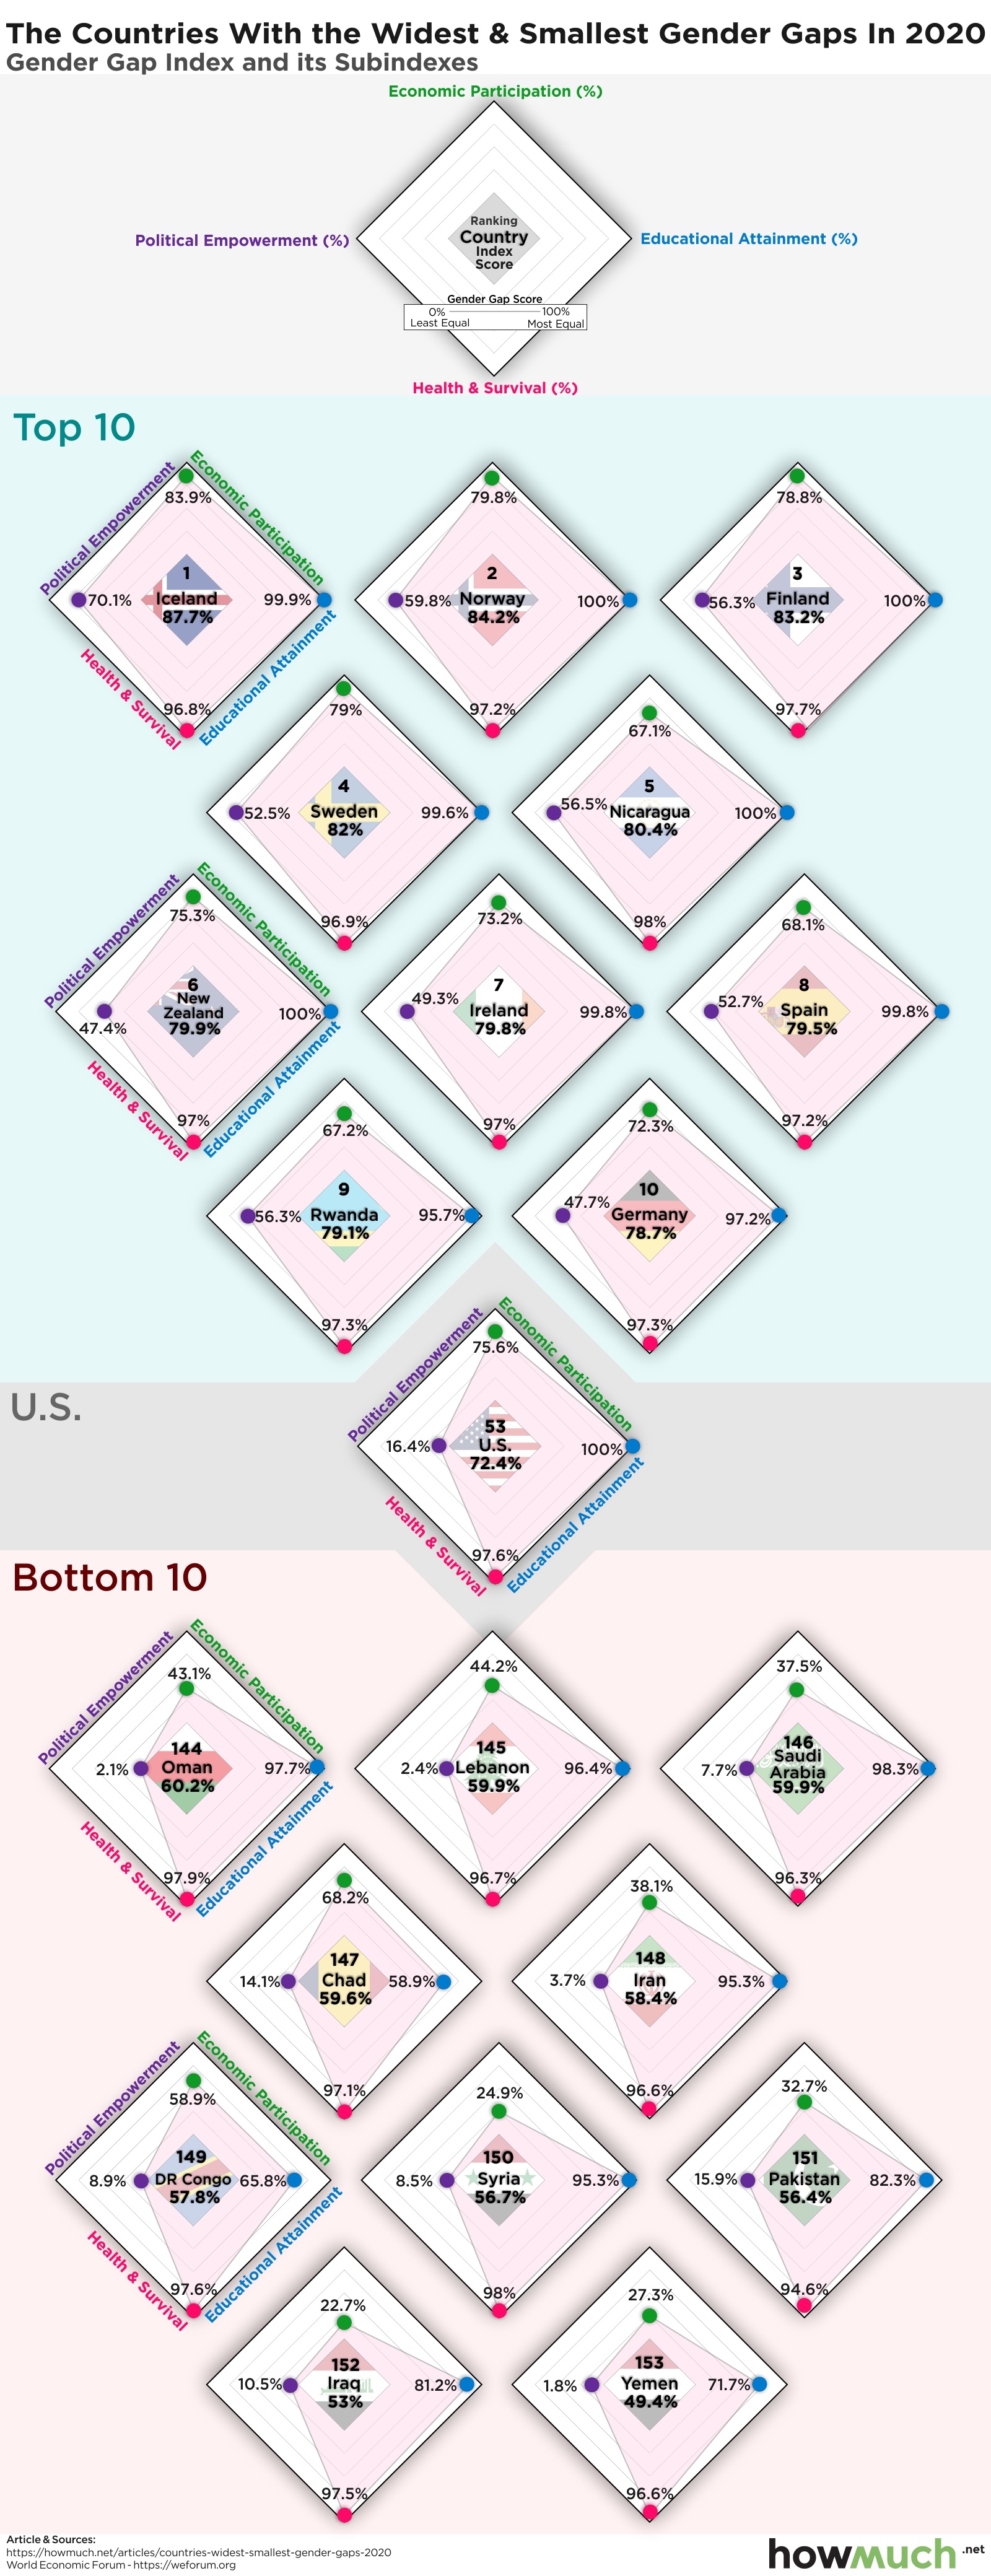
Which countries around the world lead the way in closing the gender gap and are they achieving their goals on all fronts? Our visualization lays out all the key elements for the top scorers.

April 3rd, 2026
The Economy
This visual highlights the main events impacting the growth of GDP in the U.S. economy over the last 90 years

April 3rd, 2026
Personal Finance
business
The Economy
social-issues
Wealth
What areas would you expect to drive U.S. economic output? Do more people equal more firepower, or does the location matter? Check out our county-level visualization to find out.

April 3rd, 2026
Personal Finance
business
The Economy
taxes
debt
jobs
We covered lots of different topics in 2019, from the cost of a comfortable retirement to the looming government debt bubble and the world’s gold reserves. Here’s what we deemed the 10 best visualizations for the year

April 3rd, 2026
The Economy
This visualization puts the rise of the Chinese economy over the last 30 years into perspective.

April 3rd, 2026
The Economy
trade
Where do your clothes come from? Data from the World Trade Organization offers some insight about which countries were responsible for the most clothing exports in 2018

April 3rd, 2026
The Economy
You’ve probably read a lot about the national debt in the news. But how does government spending and revenue compare when it comes to individual states?
April 3rd, 2026
The Economy
monetary-policy
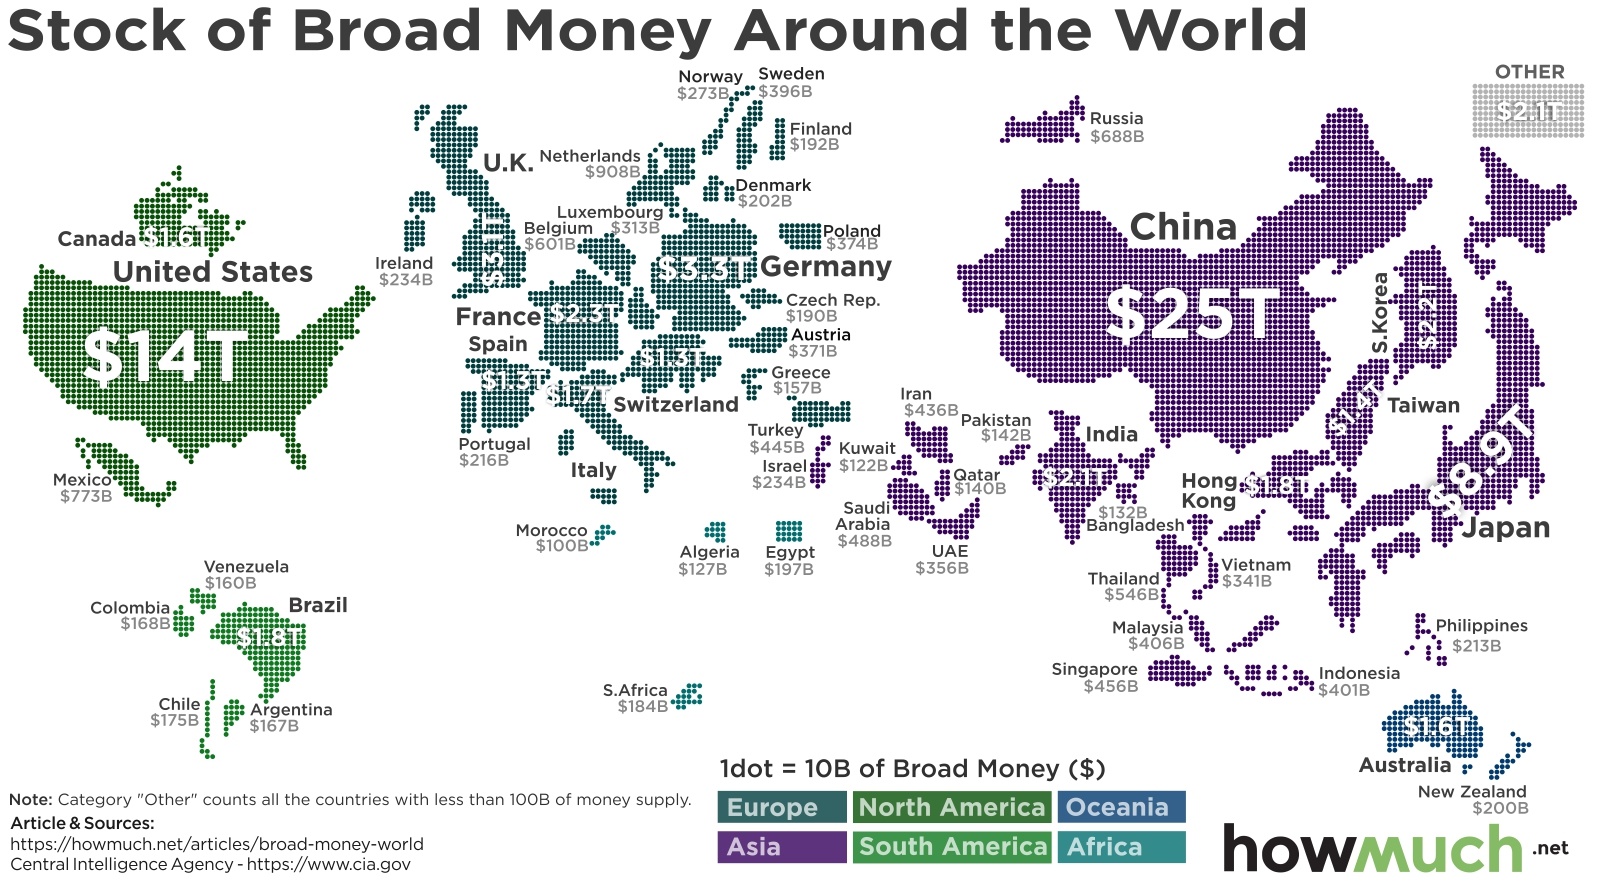
One way to compare wealth between countries is to measure the amount of money currently in circulation

April 3rd, 2026
The Economy
These 10 visuals will help you make sense of the dynamic and ever-changing U.S. economy