
April 3rd, 2026
The Economy
trade
How much are the top countries exporting each year? Check out our world map with exports listed by each country.

April 3rd, 2026
The Economy
monetary-policy
Which currencies and assets make up most of the total value of currencies in the world? The makeup and how money supply works will give you insight into global economic policy and how it affects you.

April 3rd, 2026
The Economy
The United States and China still dominate contributions of global GDP. Where will their tense relationship take the world’s economy?

April 3rd, 2026
The Economy
The impact of the trade war between the U.S. and China impacts each country differently. These visualizations help us to understand the scope and size of the possible repercussions.

April 3rd, 2026
The Economy
trade
Despite what you may know about global trade, these graphics will give you a unique insight into the global economy

April 3rd, 2026
The Economy
trade
Agriculture accounts for only 3% of the world's GDP, but employs 30% of the world’s workers. Here’s a closer look at agricultural weight in the global economy

April 3rd, 2026
The Economy
debt
Both national debt and household debt are on the rise in the U.S. What does this mean for the economy?

April 3rd, 2026
The Economy
social-issues
The cost of U.S. immigration enforcement and border security continue to rise steeply. We look at the trends since the early 1990s
April 3rd, 2026
The Economy
debt
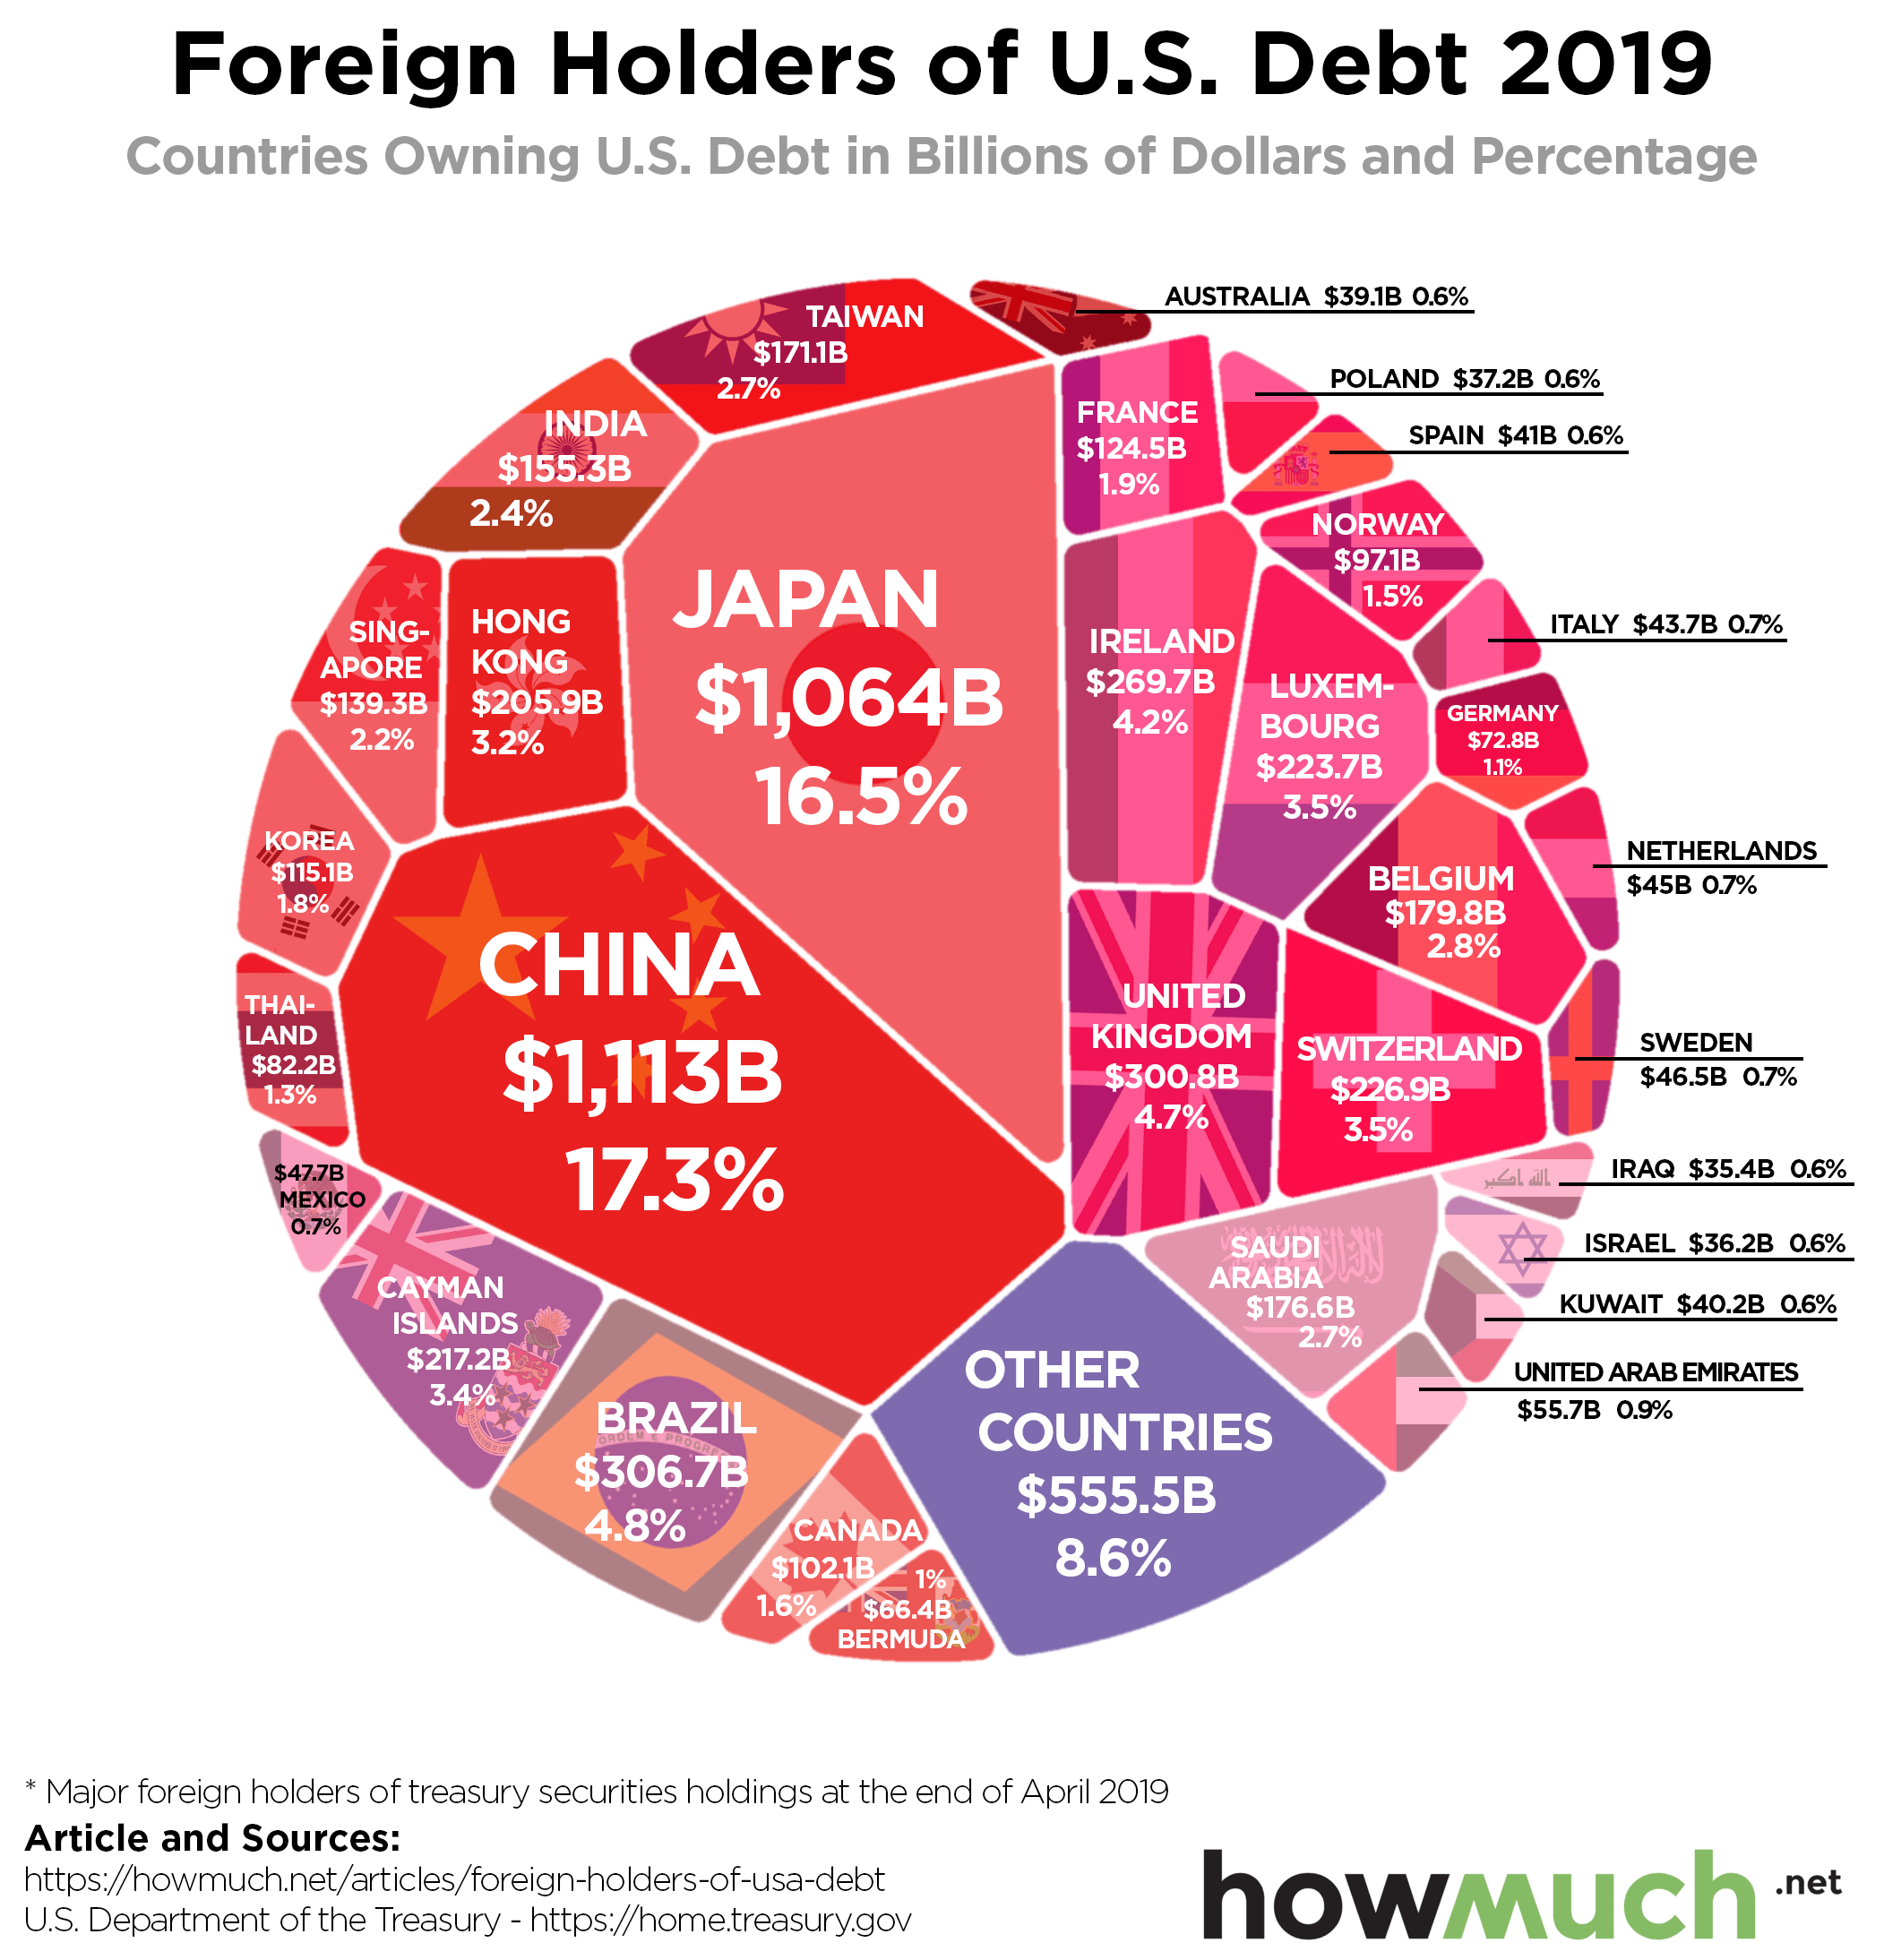
The U.S. government borrows money by issuing treasury securities, many of which are held by foreign countries. Here’s a breakdown of which foreign countries own the most U.S. debt

April 3rd, 2026
The Economy
trade
As the trade war between the U.S. and China escalates, our visualization highlights how the trade deficit between these two countries has grown over time