September 25th, 2019
The Economy
Trade
How big of an impact does the services sector have on the world economy? Take a look at our visualizations to learn more.

September 19th, 2019
The Economy
Trade
A quarter of what the world produces is categorized as “industry.” Here’s how industry output varies from country to country.

September 17th, 2019
The Economy
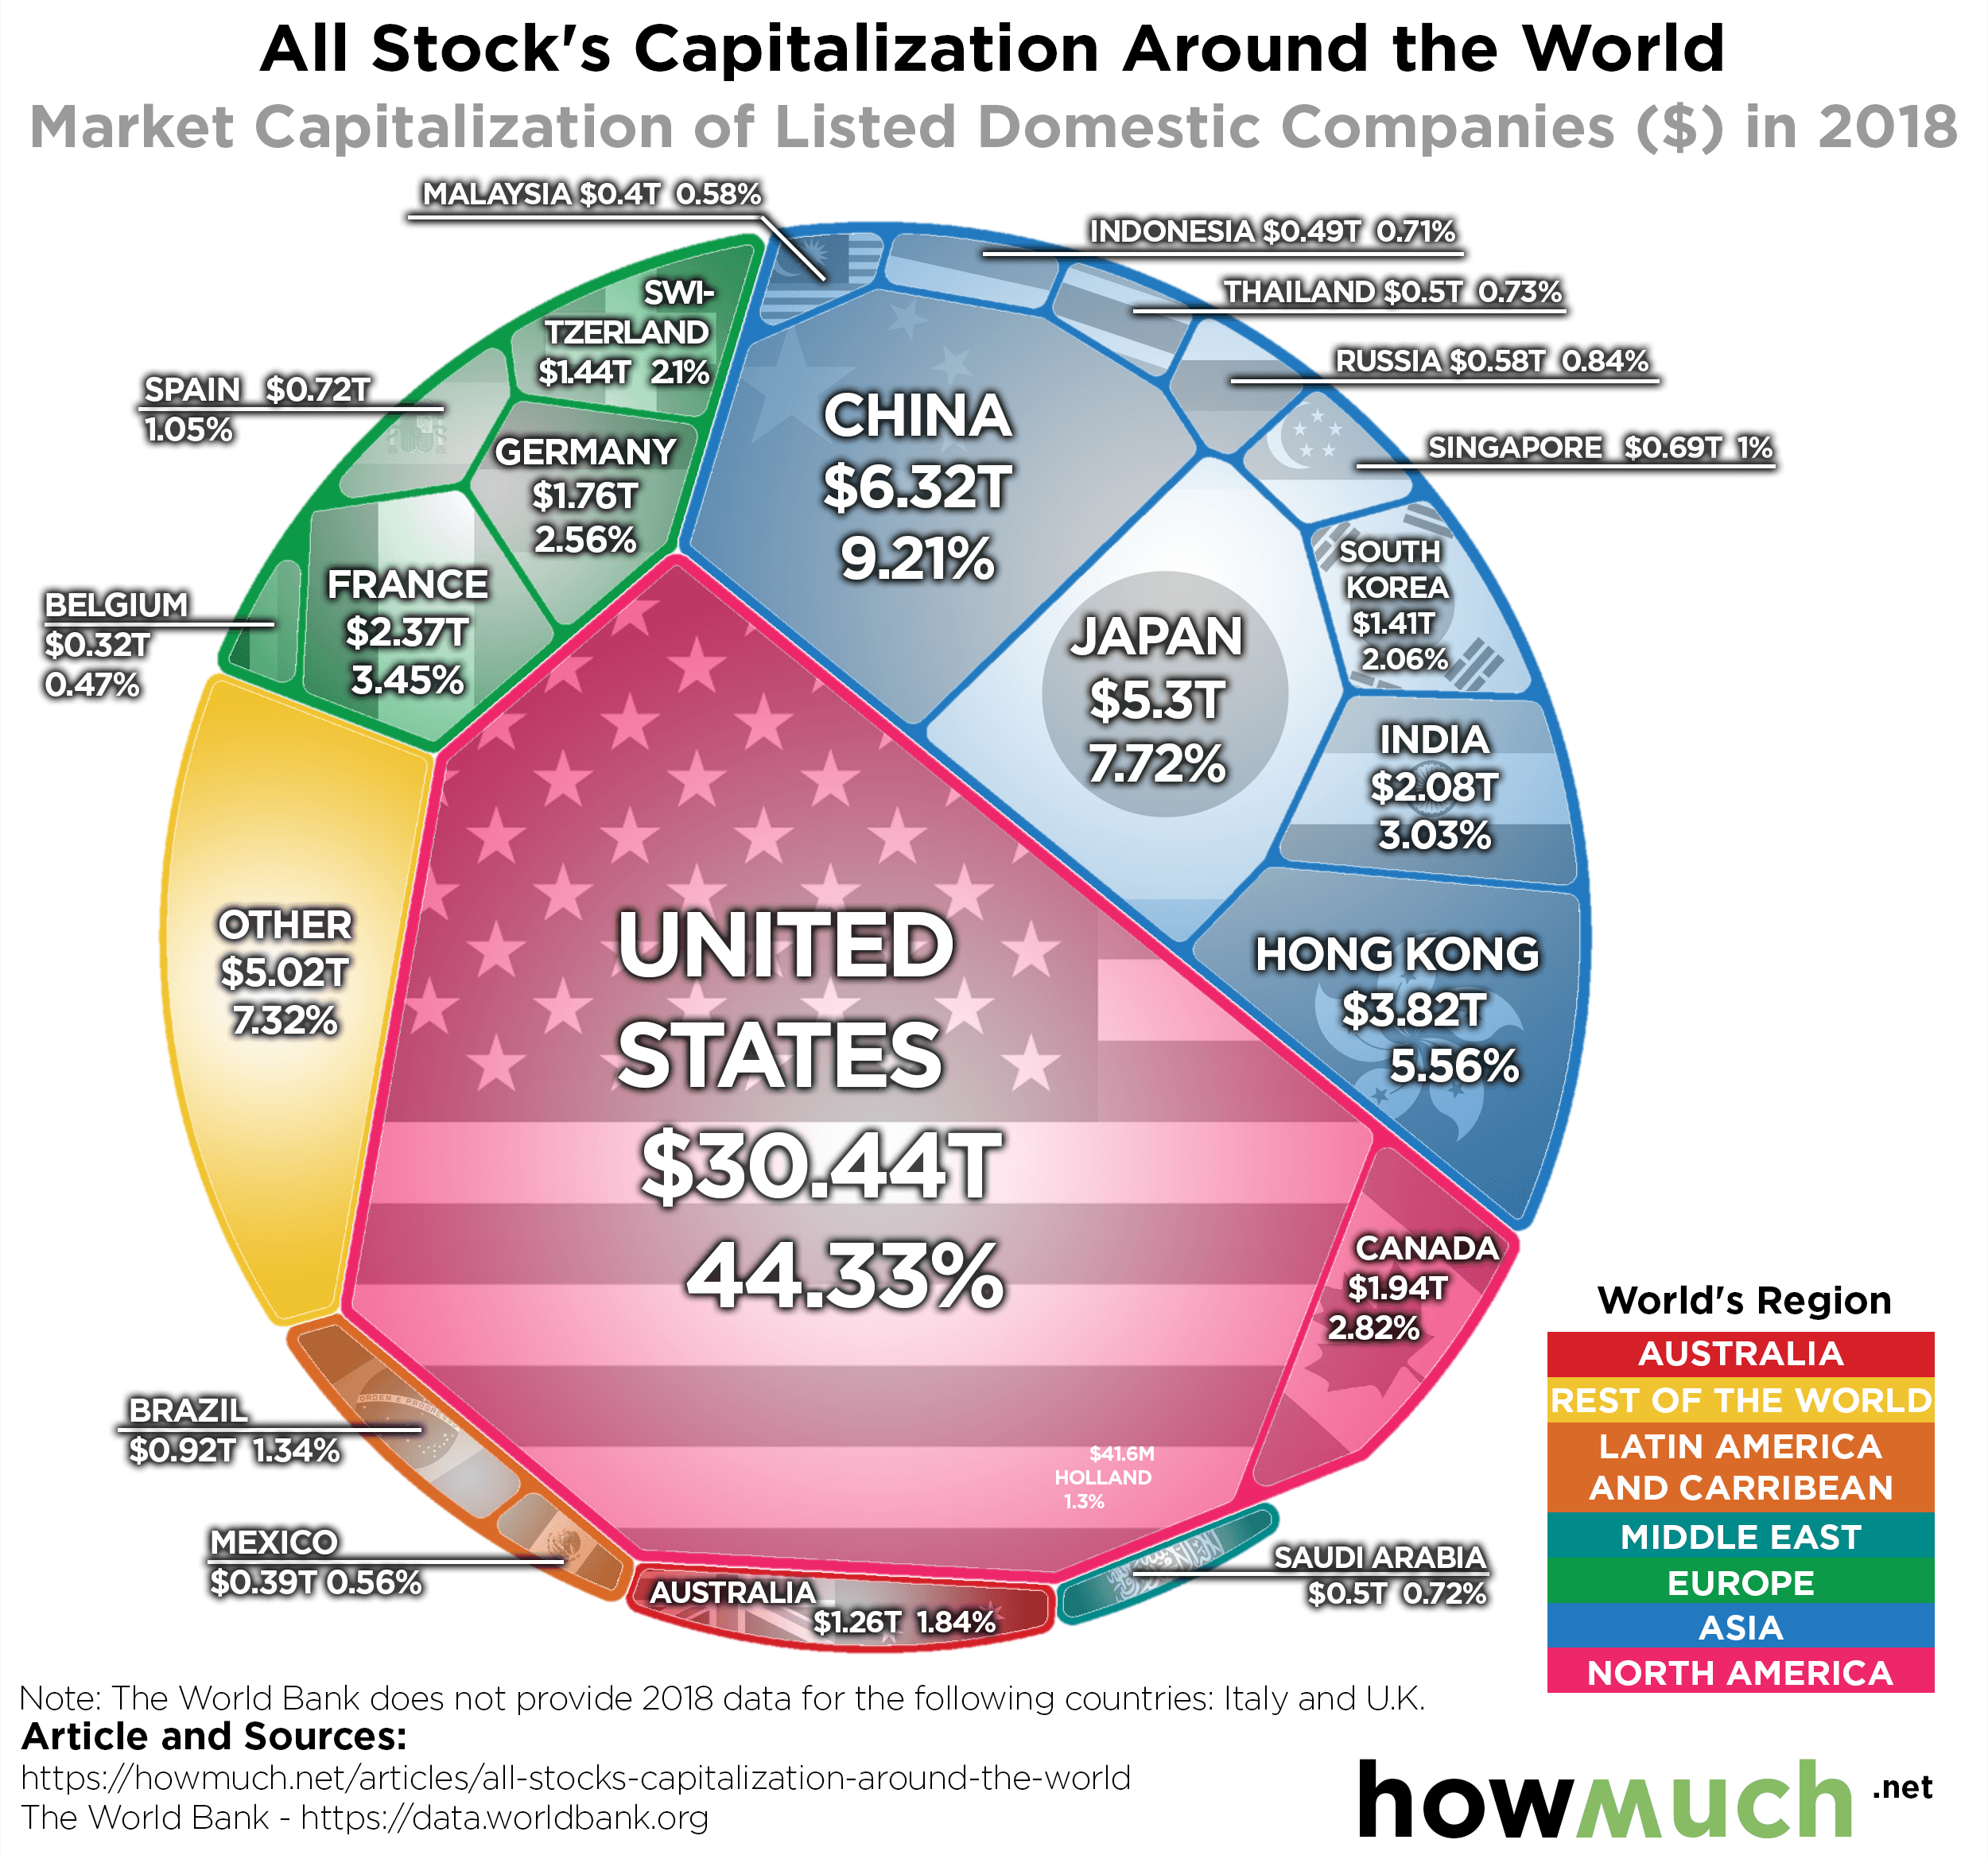
The U.S. dominates the global equity market with nearly 50% of global stock market value. But, do regional players stand a chance against this behemoth?

September 16th, 2019
The Economy
Trade
The global plastic export market is in for some major changes. Here is a look at the major plastic exporting countries and how they are adapting.

September 16th, 2019
The Economy
Love to travel? See where most tourists are spending their vacation dollars.

September 11th, 2019
The Economy
On the edge of a potential recession, we gauge the economic well-being of all states.

September 11th, 2019
The Economy
As fears of a global economic slowdown loom, our new visualization looks at the breakdown of GDP around the world, as adjusted by purchasing power parity.

September 9th, 2019
The Economy
Trade
As the trade war drags on, here’s a look at which states stand to lose the most from tariffs.

September 9th, 2019
The Economy
Trade
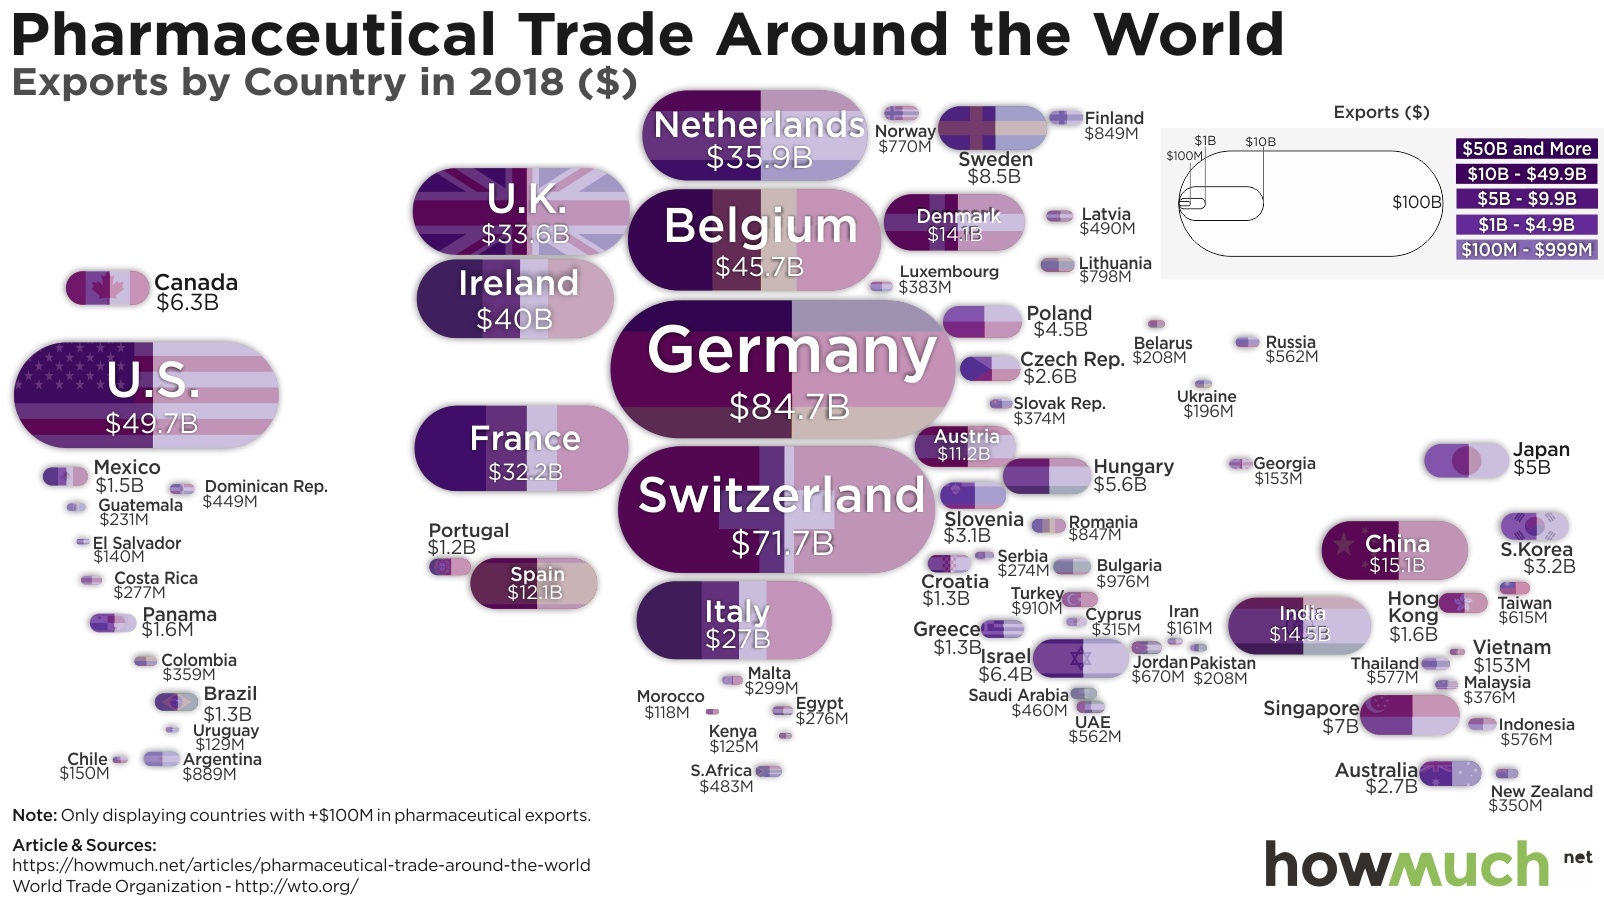
Pharmaceuticals have a major impact on the global economy. But who are the biggest suppliers and consumers? We created a visualization to show how much countries around the world import and export pharmaceuticals in terms of dollars.

September 3rd, 2019
The Economy
Monetary Policy
You likely are aware that the dollar is less powerful than it was 100 years ago, but just how much has the dollar’s purchasing power decreased? Check out this visualization to find out more.