
April 3rd, 2026
business
investments
Wealth
What is “fintech,” and how is it changing the way you deal with money?

April 3rd, 2026
Personal Finance
Wealth
Income inequality is a major talking point around the world. This map compares the threshold needed to join the top 1% and 50% of income earners in several countries around the world
April 3rd, 2026
Personal Finance
debt
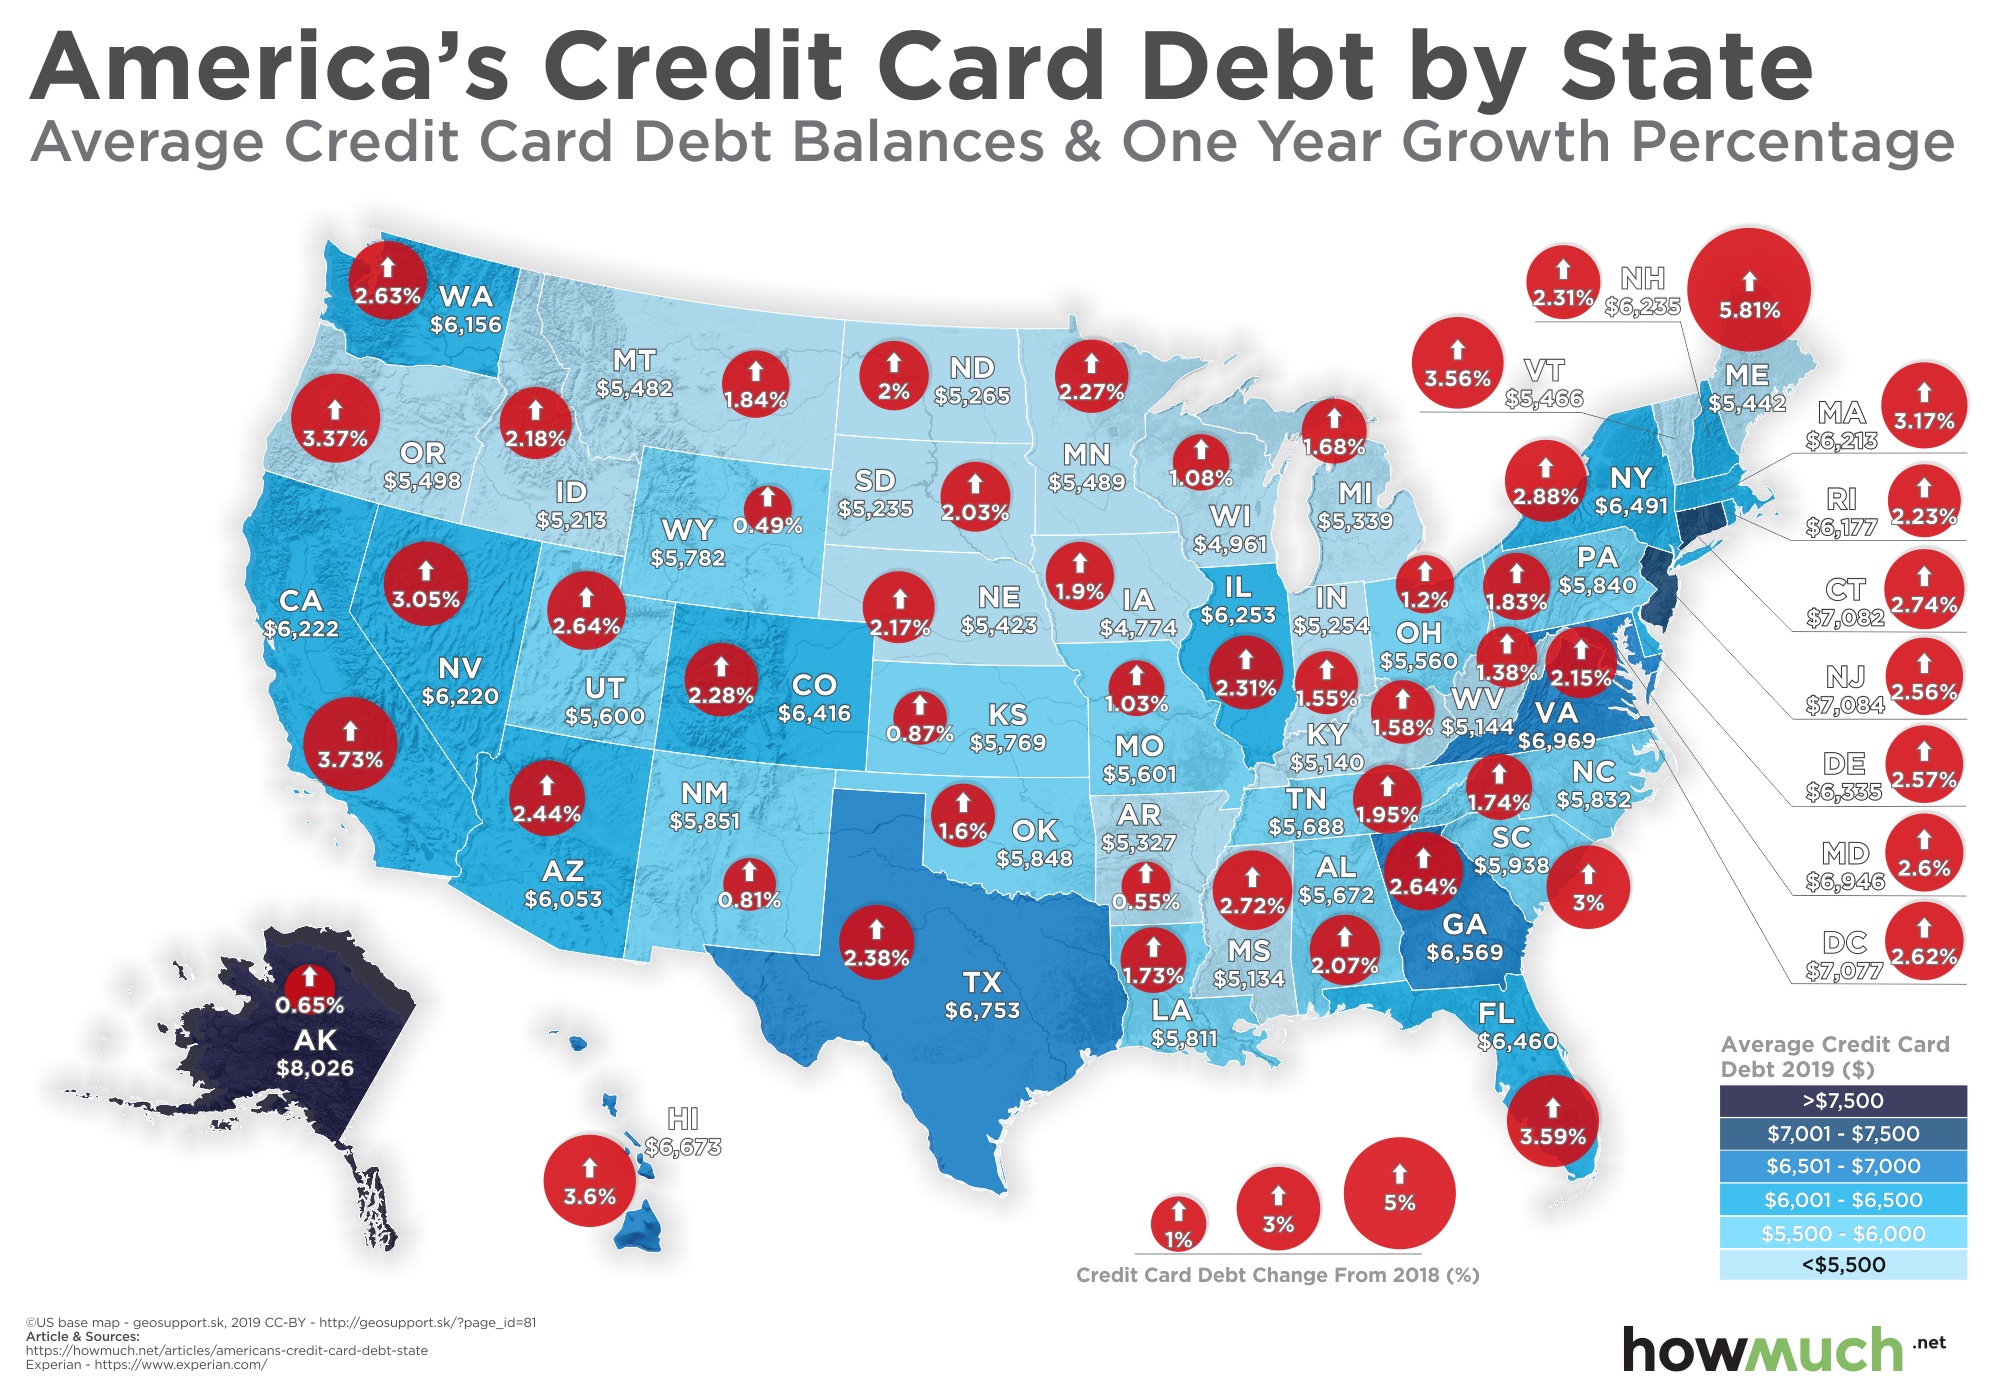
Credit card debt is up across the nation. What states are most affected, and why?

April 3rd, 2026
business
The Economy
social-issues
monetary-policy
Wealth
February 2020 five visuals we wish we had created because they are that good!

April 3rd, 2026
business
Forming an LLC is one of the first steps in founding a company. Our visualization reveals how much it costs for every state across the country

April 3rd, 2026
business
The Economy
monetary-policy
What’s the best way to understand the relative size of the U.S. economy? American GDP is so big that individual cities generate as much economic activity as entire countries.

April 3rd, 2026
business
The Economy
investments
See where the top 100 brands in the world come from and which sectors dominate the ranking.

April 3rd, 2026
Personal Finance
Real Estate
social-issues
What are Americans paying in renters insurance, and will these numbers change with the housing boom?
April 3rd, 2026
Personal Finance
Real Estate
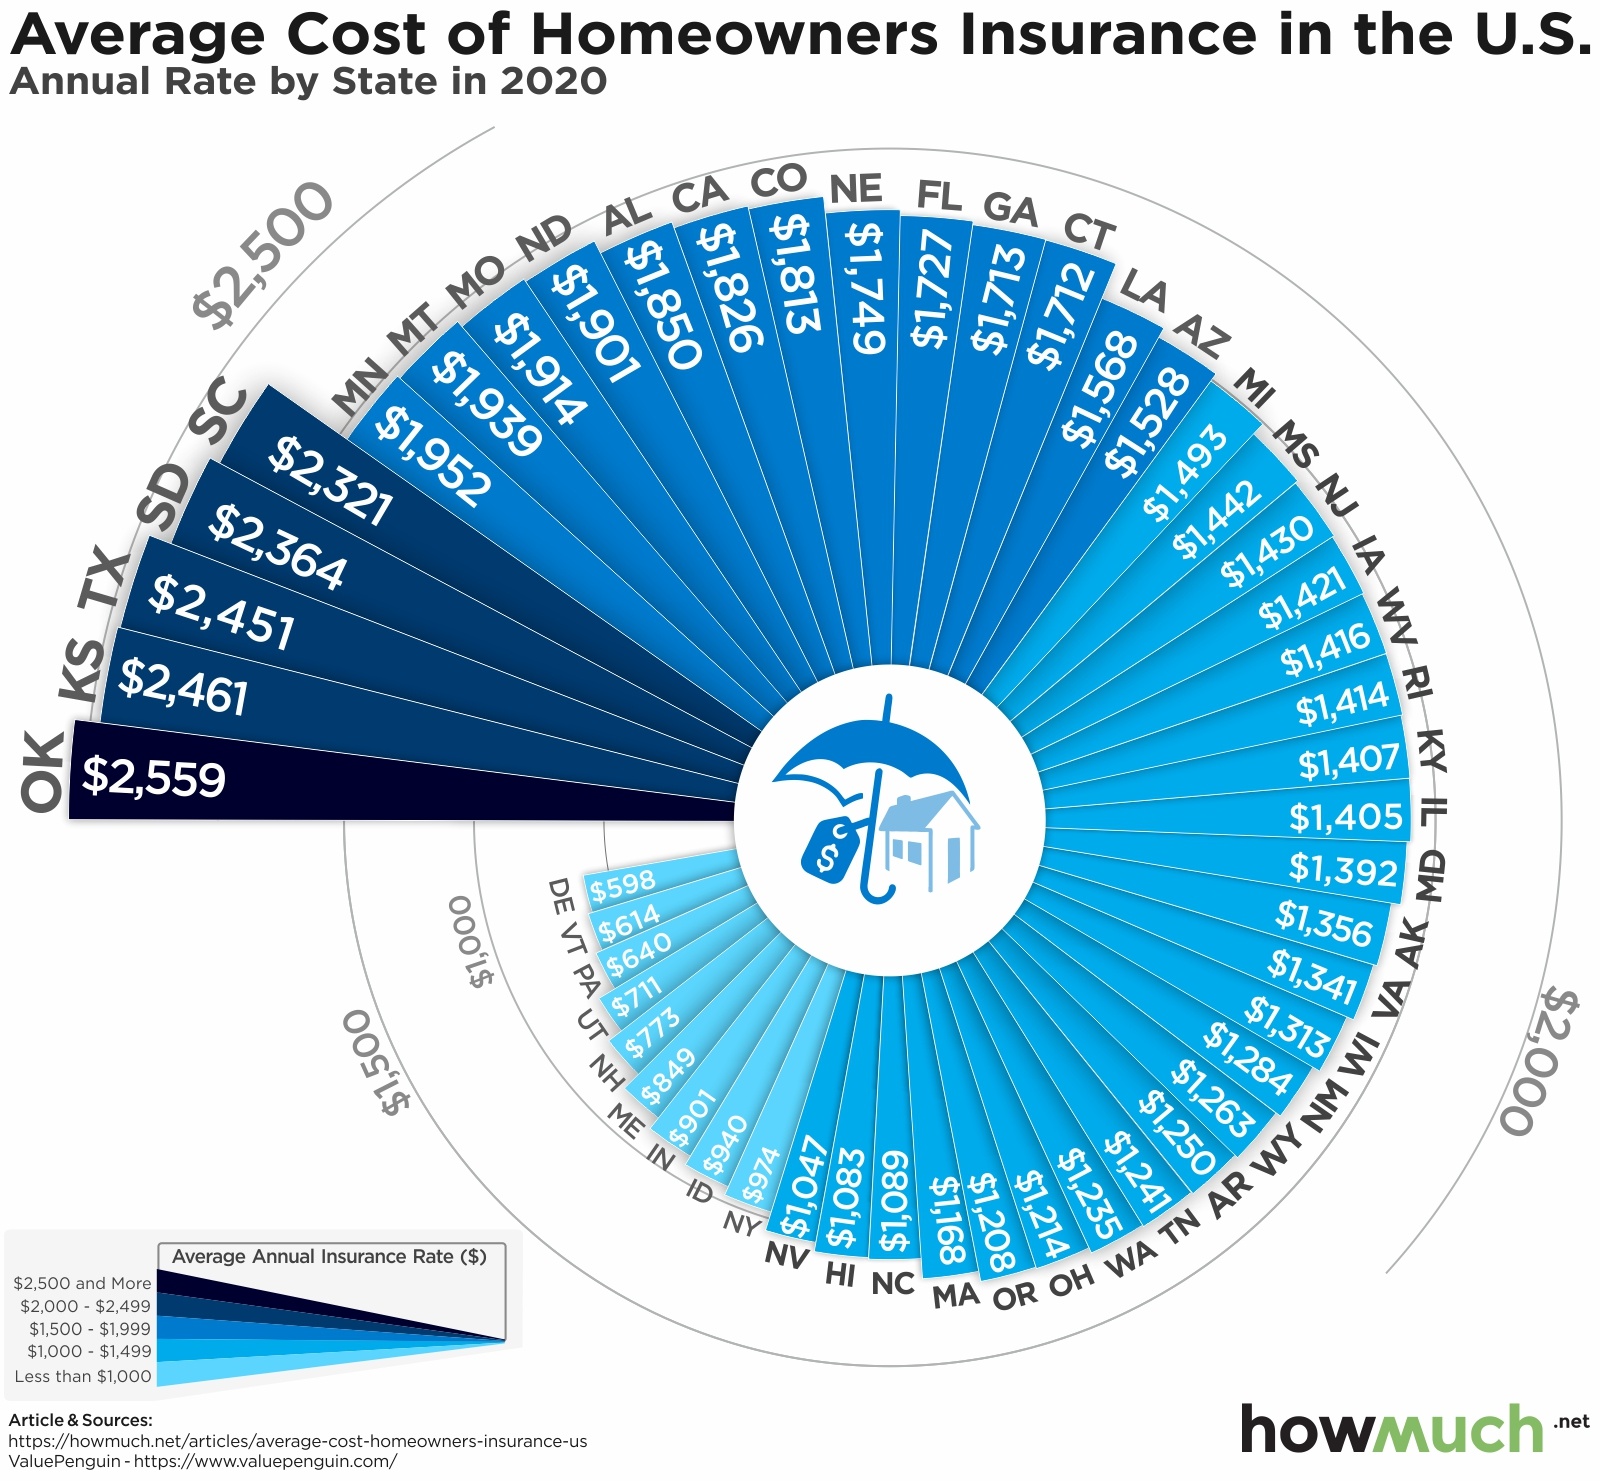
Homeowners insurance is a critical part of financial security. See how much it costs this year in every state

April 3rd, 2026
The Economy
trade
While the U.S. is categorized overall as a “net importer” of goods, these visualizations reveal that the balance of U.S. trade varies significantly from trading partner to trading partner