June 9th, 2021
Personal Finance
Business
The Economy
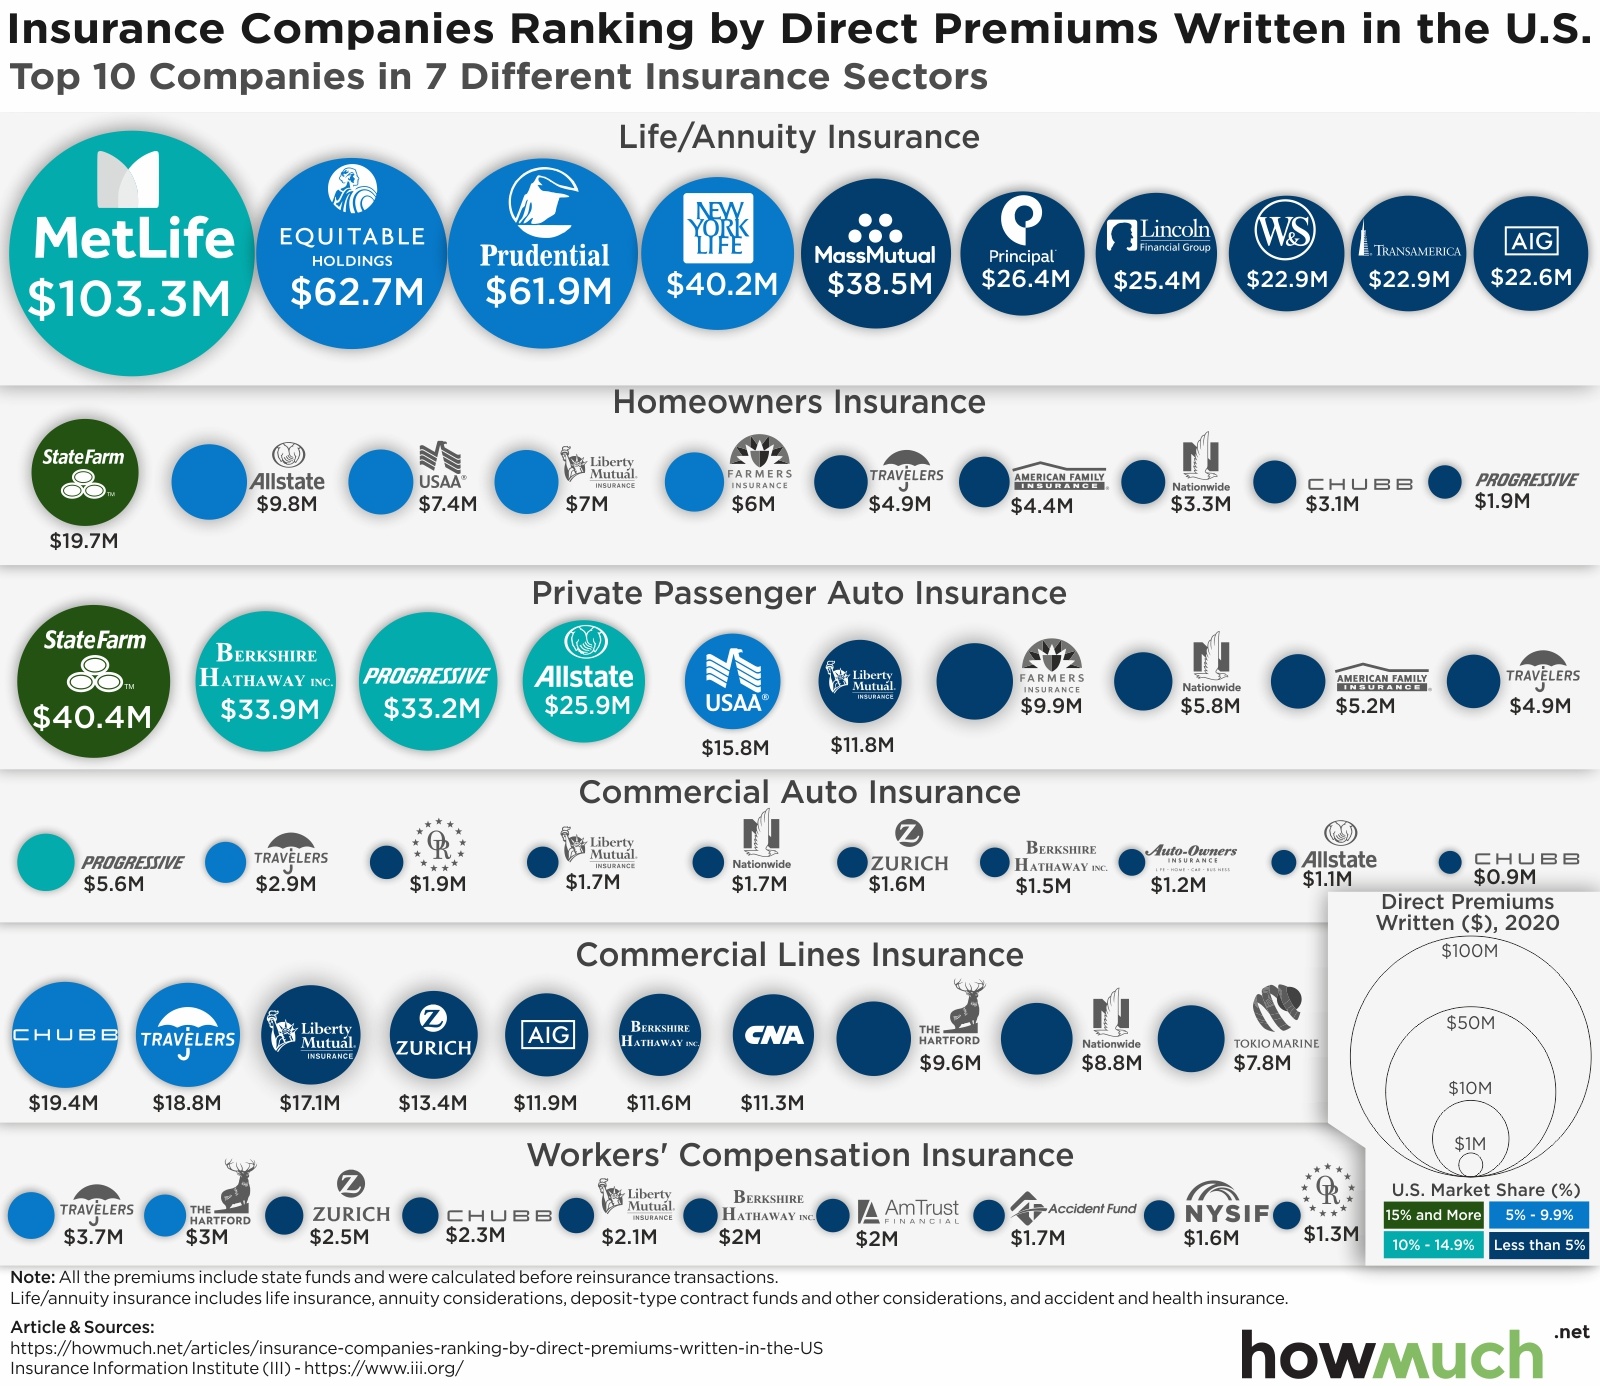
Insurance companies took in hundreds of millions last year in direct premiums. Here are the top 10 winners in each sector

May 27th, 2021
Personal Finance
This article and accompanying visualizations discuss the monthly VA Dependency and Indemnity Compensation rates for surviving spouses and eligible children of U.S. Veterans as of 2021

May 25th, 2021
Personal Finance
VA approved home loans are guaranteed by the U.S. government as a special benefit for military veterans. Here’s how many loans and how much money on average is flowing to the U.S. housing market through this program

May 11th, 2021
Personal Finance
Jobs

April 8th, 2021
Personal Finance
Jobs
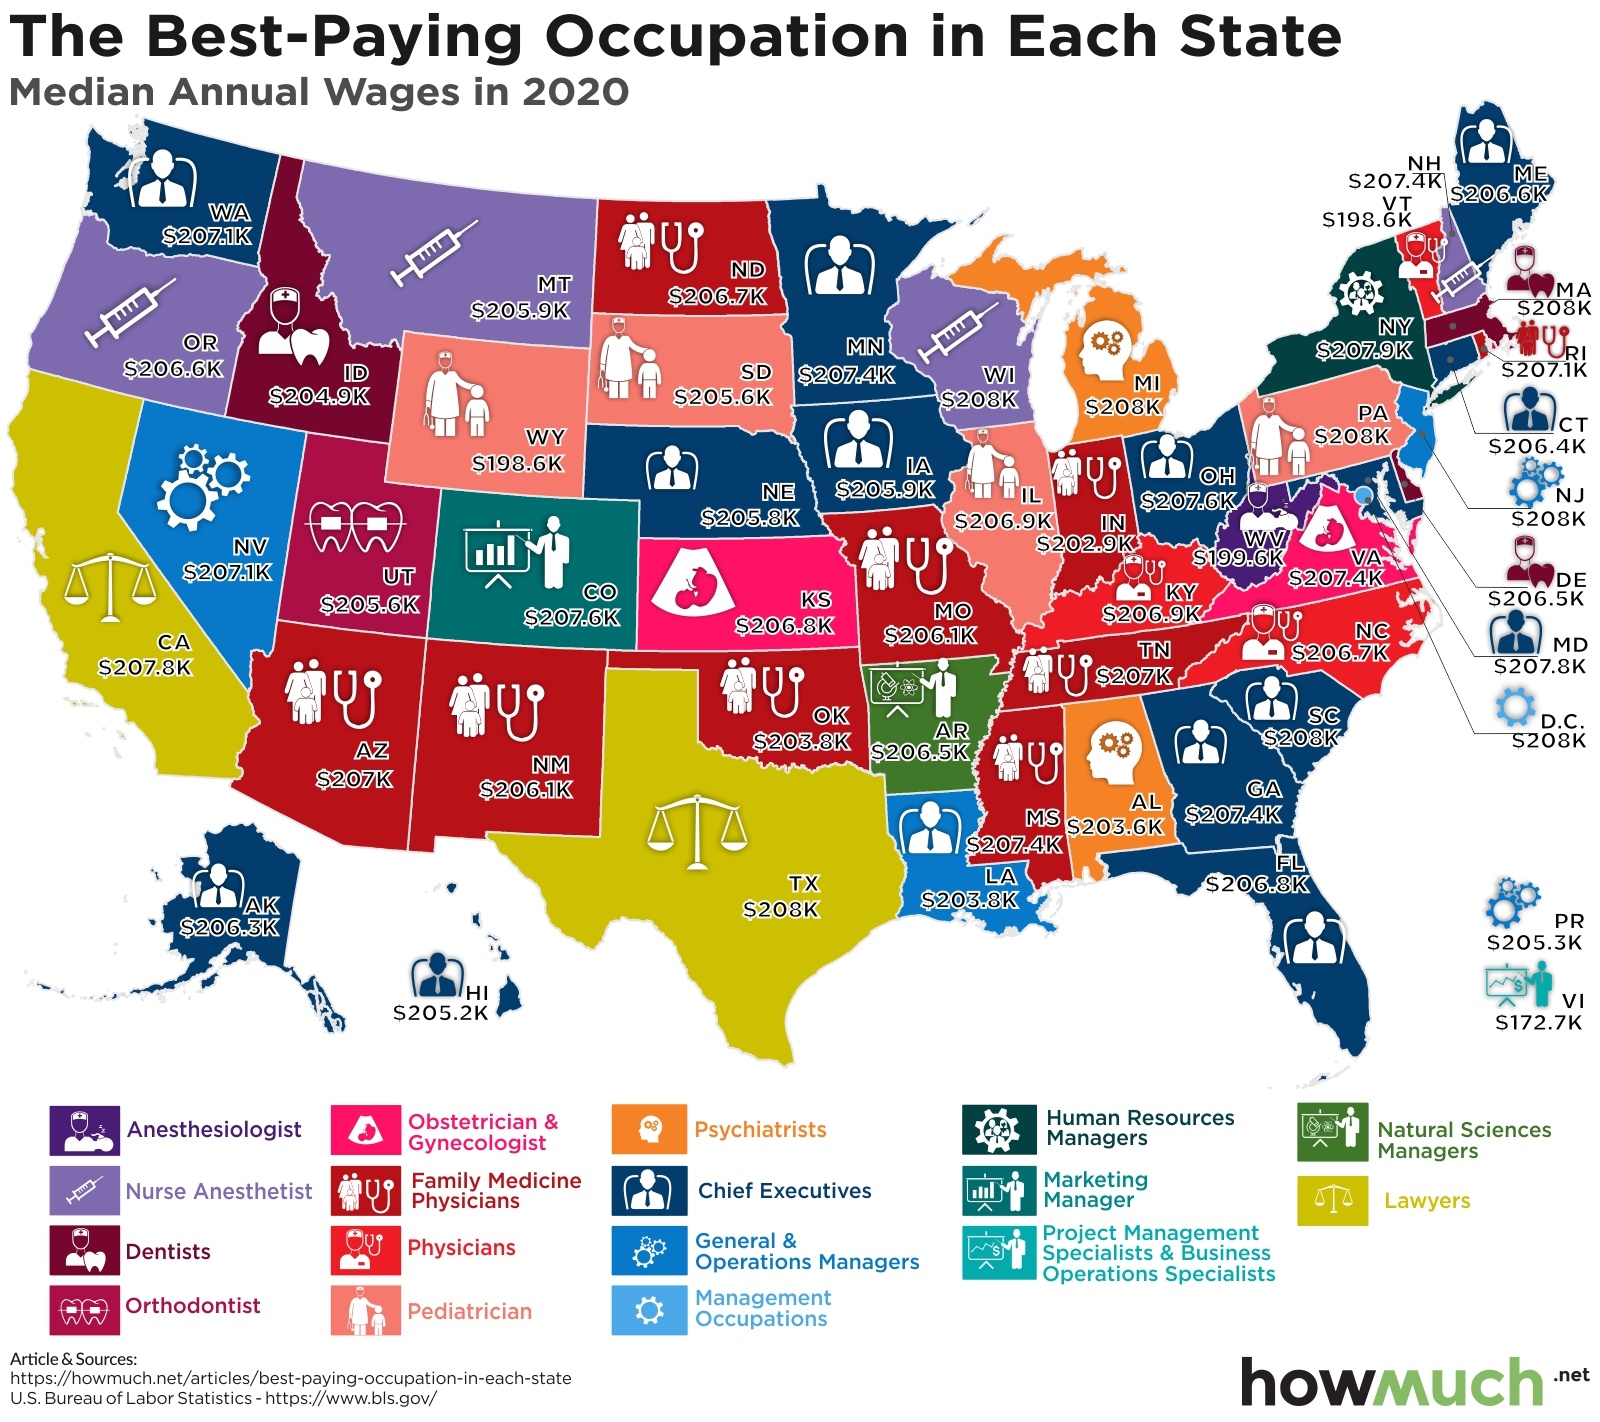
This map shows the highest paid occupation in every state in the country

March 30th, 2021
Personal Finance
The Economy
Social Issues
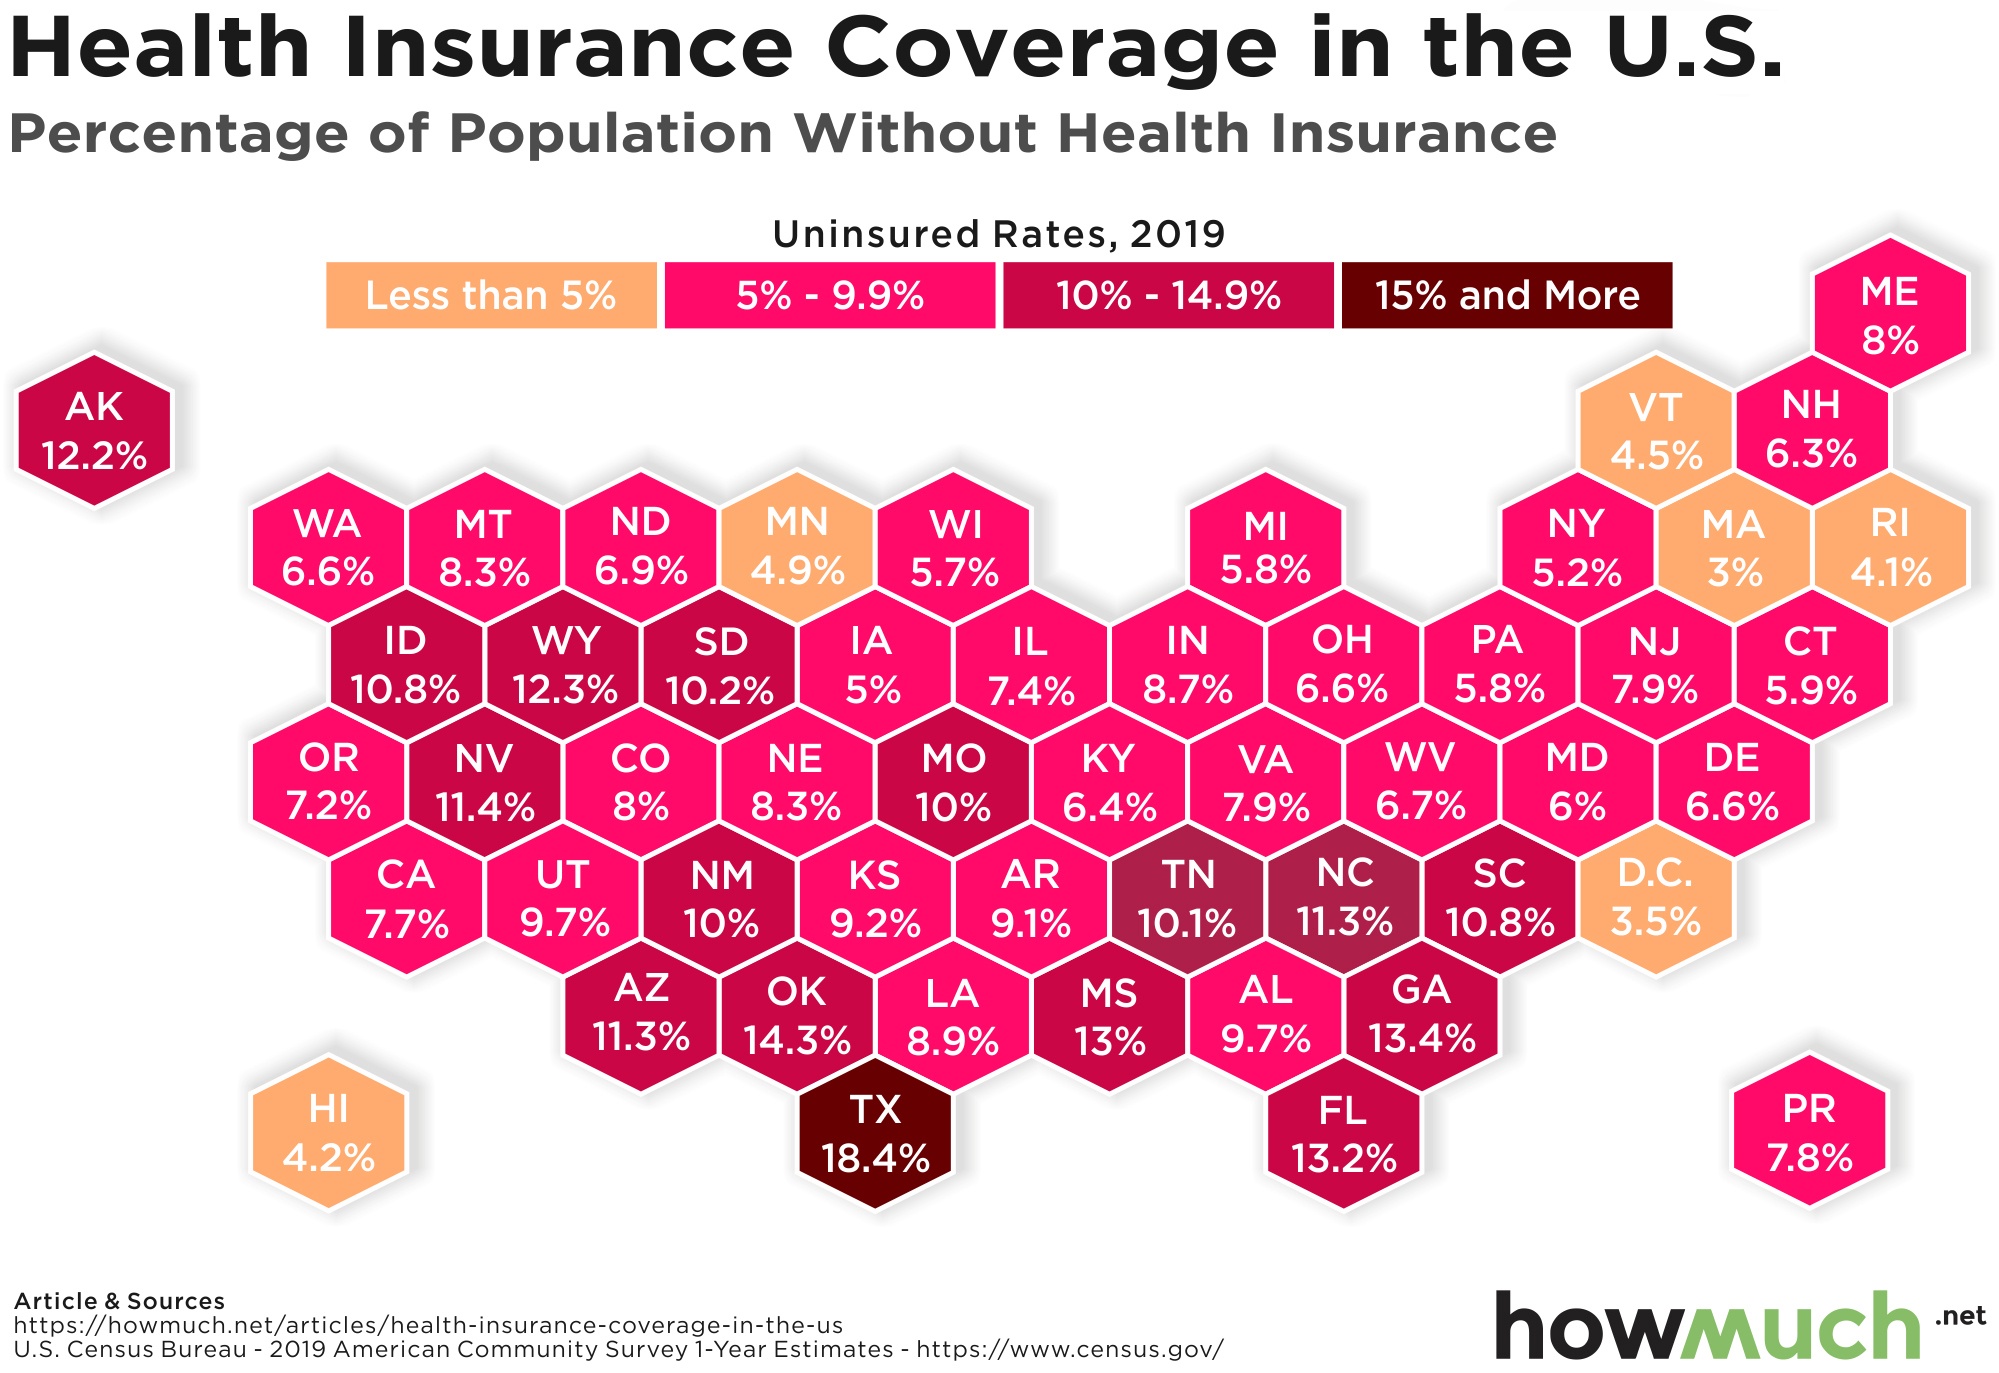
There are a lot of Americans who don’t have health insurance. Here’s the rate of uninsured Americans in every state

March 16th, 2021
Personal Finance
The Economy
Real Estate
This visualization shows a map of median U.S. home prices with a percentage of households who can pay for the new home, pointing out just how hard it is for most Americans to afford their own houses

March 4th, 2021
Personal Finance
Social Issues
The gender wage gap refers to how men make more money than women. This visualization shows which industries have the biggest problem paying women less than men

February 8th, 2021
Personal Finance
Debt
A lot of people are paying down their credit cards during the COVID-19 pandemic. These visualizations show which states and generations are making the most progress

February 1st, 2021
Personal Finance
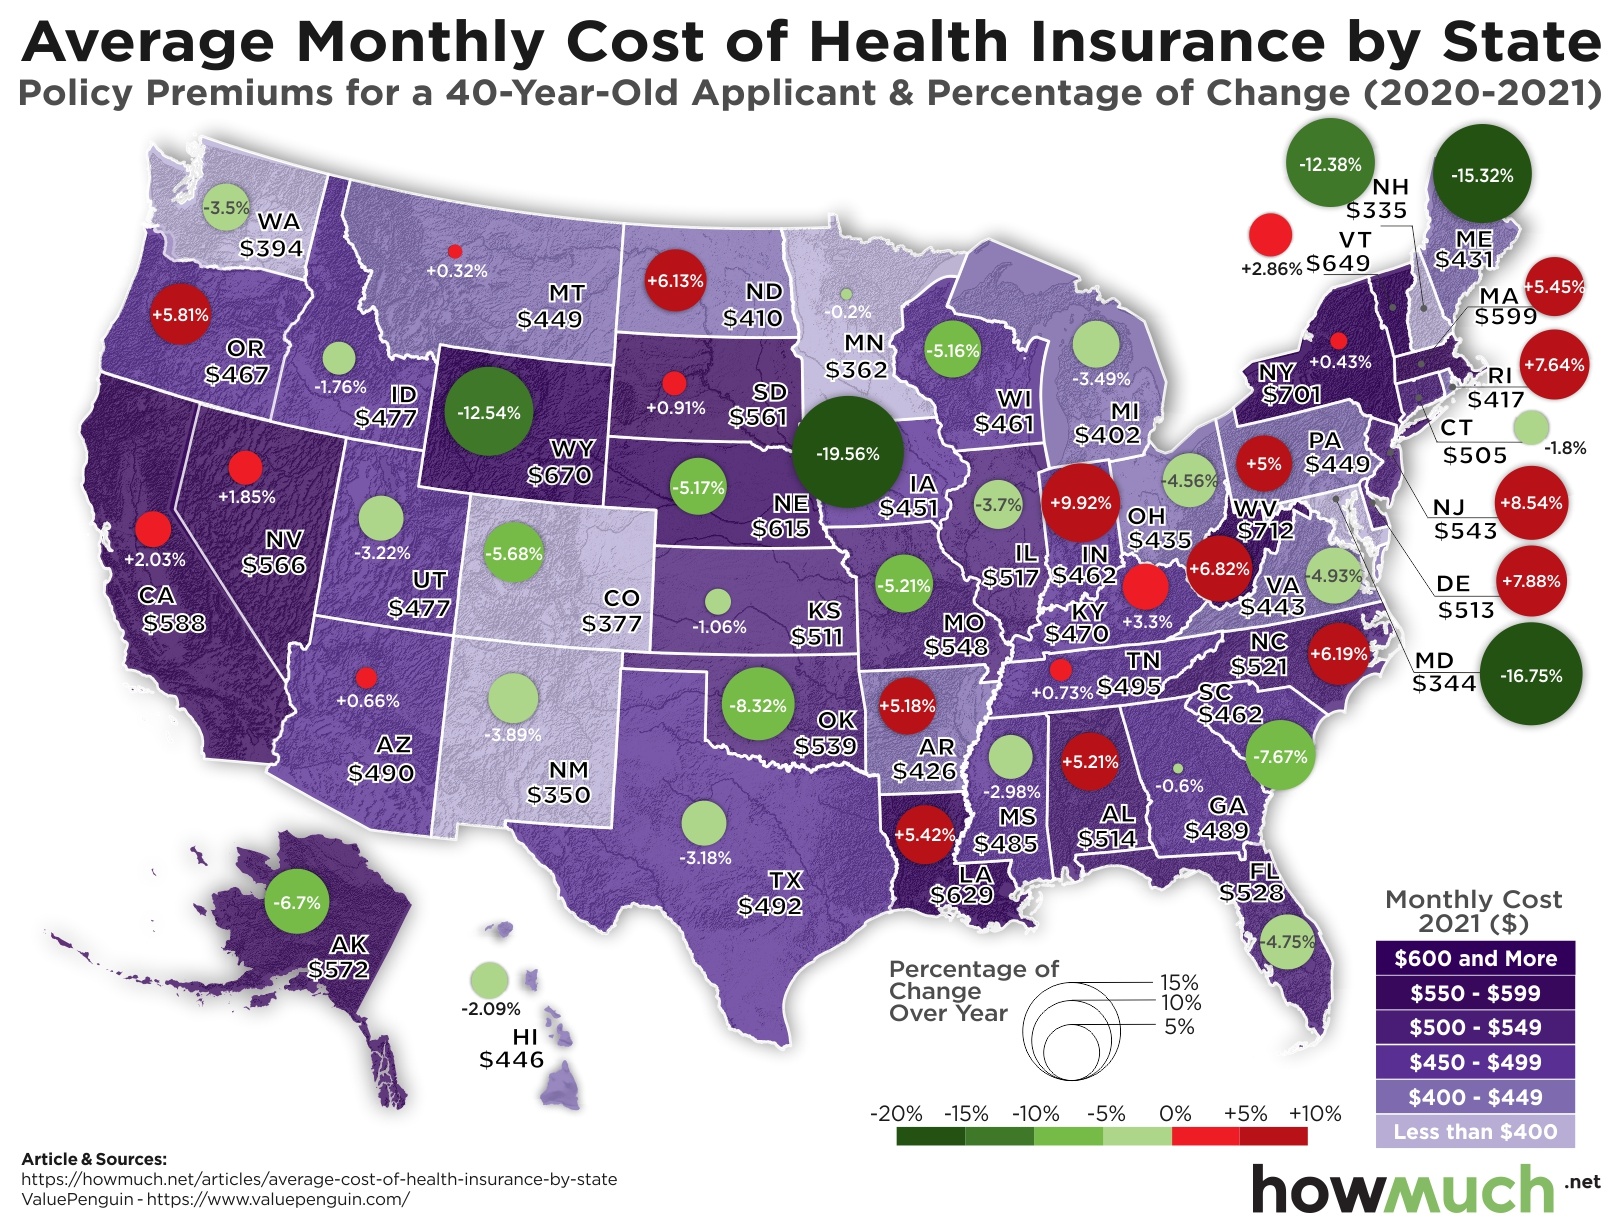
How much does health insurance cost? This map shows that the answer depends a lot on where you live