
April 3rd, 2026
Personal Finance
business
The Economy
Wealth
Almost every state in the country is home to at least one billionaire, according to our latest map of the richest people across the U.S.

April 3rd, 2026
Personal Finance
social-issues
Wealth
These visualizations illustrate the economic inequality between the black and white community in the U.S., updating our work from last year
April 3rd, 2026
Personal Finance
business
Wealth
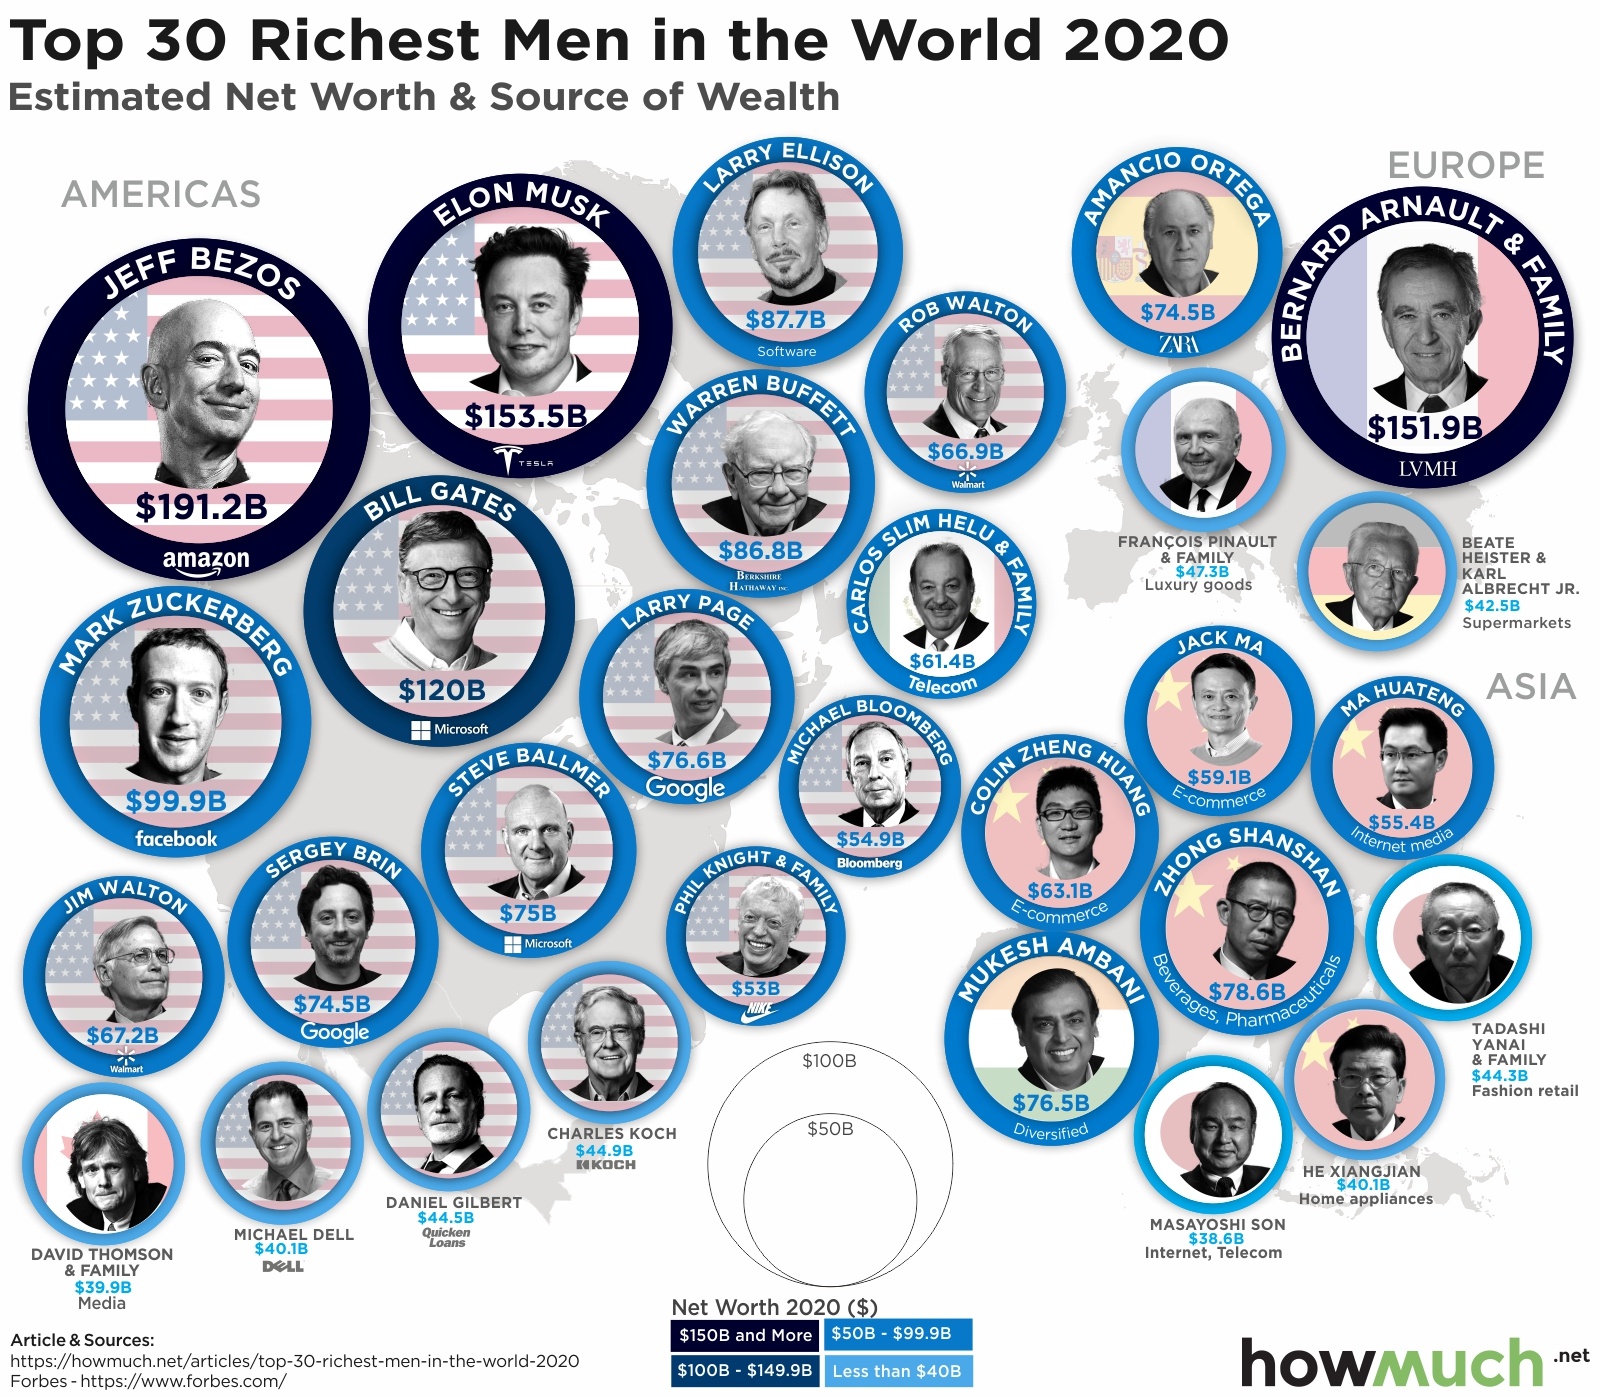
How much are the richest people in the world worth? This map stacks up the fortunes of the world’s 30 richest men

April 3rd, 2026
Personal Finance
business
The Economy
trade
Wealth
jobs
We pulled together our most popular visualizations of 2020 to let you know what's trending. Not surprisingly, economic issues and wealth landed at the top of our list

April 3rd, 2026
Personal Finance
Congress is still debating how big the next round of economic stimulus should be. Here’s what Americans did with the first round of direct payments, and what they say they’ll do with another.

April 3rd, 2026
Personal Finance
business
Wealth
The world’s richest people come from a variety of different industries and backgrounds. Here’re the richest men in 2020.

April 3rd, 2026
Personal Finance
business
The business insurance market has a few key players getting the lionshare of annual revenue. Check out this visualization to see the top 25

April 3rd, 2026
Personal Finance
The Economy
social-issues
Our new visualization shows how the current unemployment rate stacks up against unemployment rates in the past century.

April 3rd, 2026
Personal Finance
social-issues
Wealth
These three visualizations highlight an enormous racial income gap between white and African American workers across the country.

April 3rd, 2026
Personal Finance
jobs
Workers’ compensation is a building block for financial security, but how much it costs depends on where you live. This visualization breaks down the most and least expensive states for workers’ compensation.