
April 3rd, 2026
Personal Finance
debt
A lot of people are paying down their credit cards during the COVID-19 pandemic. These visualizations show which states and generations are making the most progress

April 3rd, 2026
The Economy
investments
WallStreetBets is crushing a lot of hedge funds right now. Here’s how Reddit investors have moved the share price for several companies
April 3rd, 2026
Personal Finance
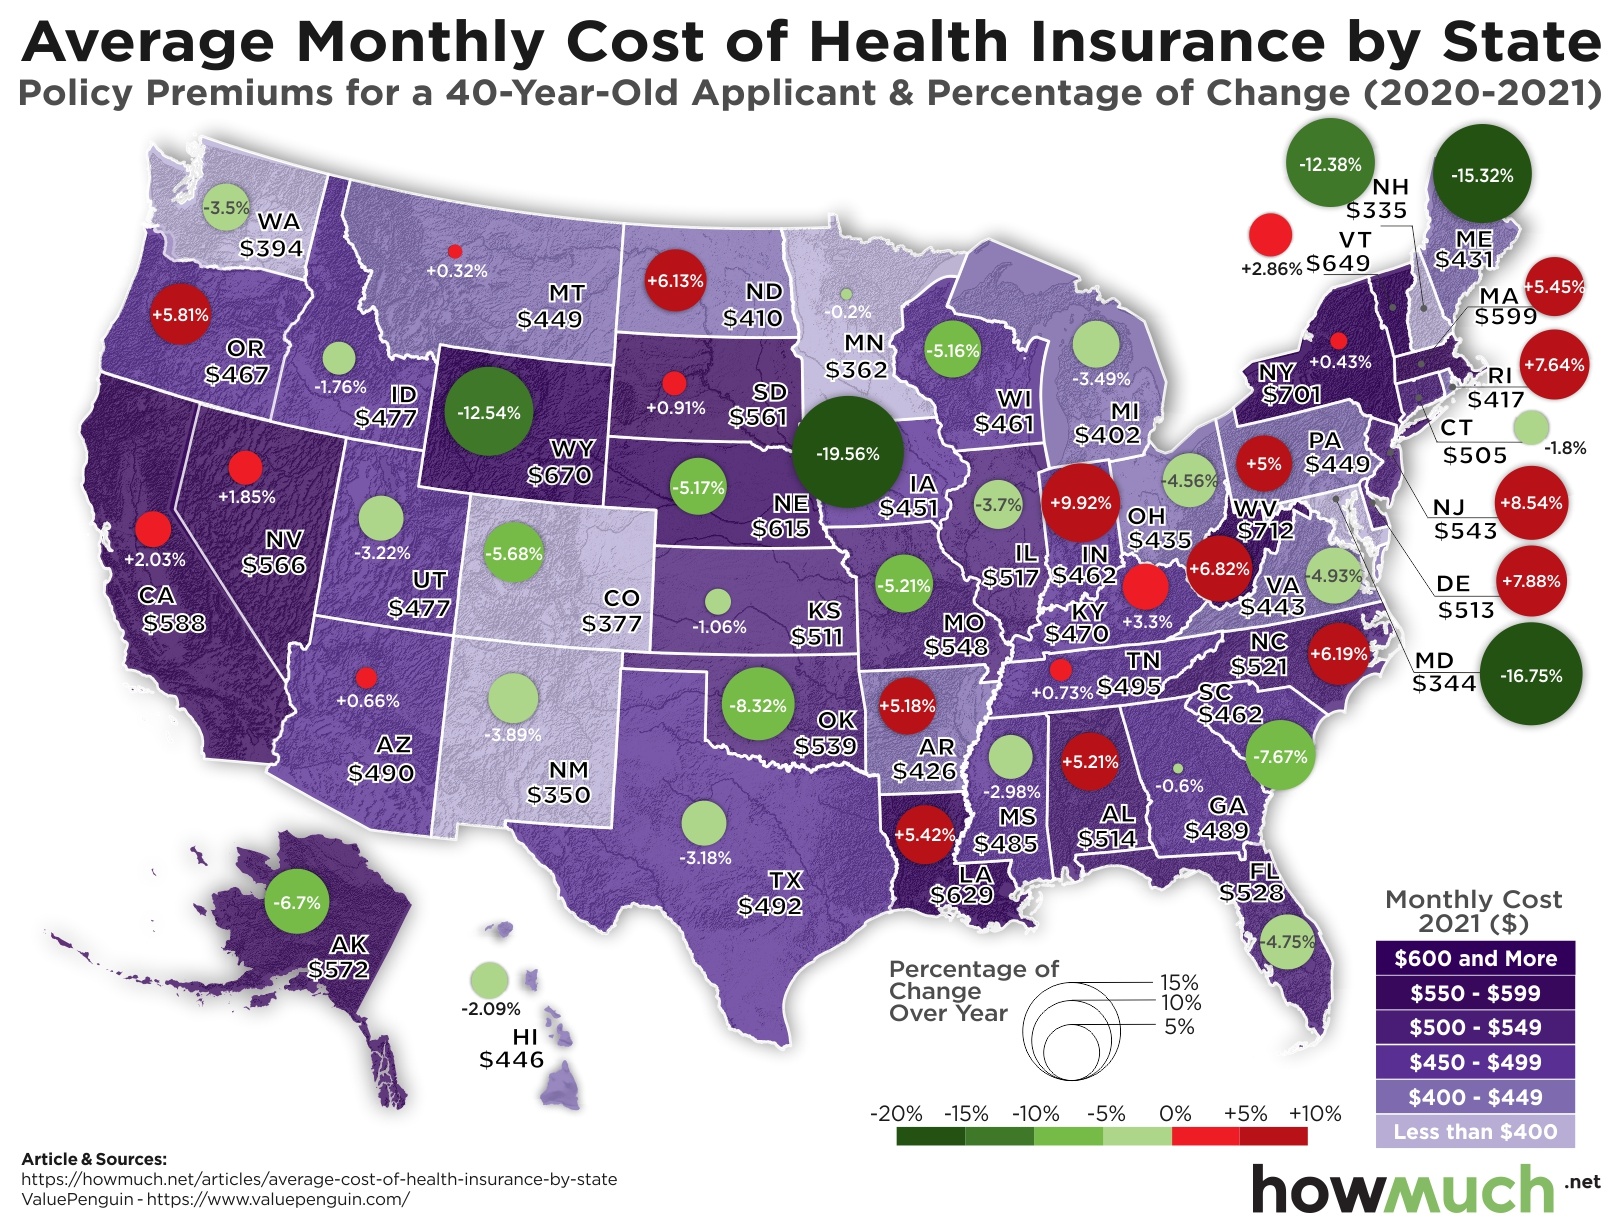
How much does health insurance cost? This map shows that the answer depends a lot on where you live

April 3rd, 2026
The Economy
COVID-19 made 2020 one of the most challenging years in recent memory, however, this visualization shows how a series of devastating natural disasters also brought untold economic pain

April 3rd, 2026
Personal Finance
business
The Economy
Wealth
Almost every state in the country is home to at least one billionaire, according to our latest map of the richest people across the U.S.

April 3rd, 2026
Personal Finance
social-issues
Wealth
These visualizations illustrate the economic inequality between the black and white community in the U.S., updating our work from last year

April 3rd, 2026
business
The Economy
2020 was a bad year, but not for the stock market. The S&P 500 turned in one of its best annual performances despite many enduring challenges from a difficult year
April 3rd, 2026
Personal Finance
business
Wealth
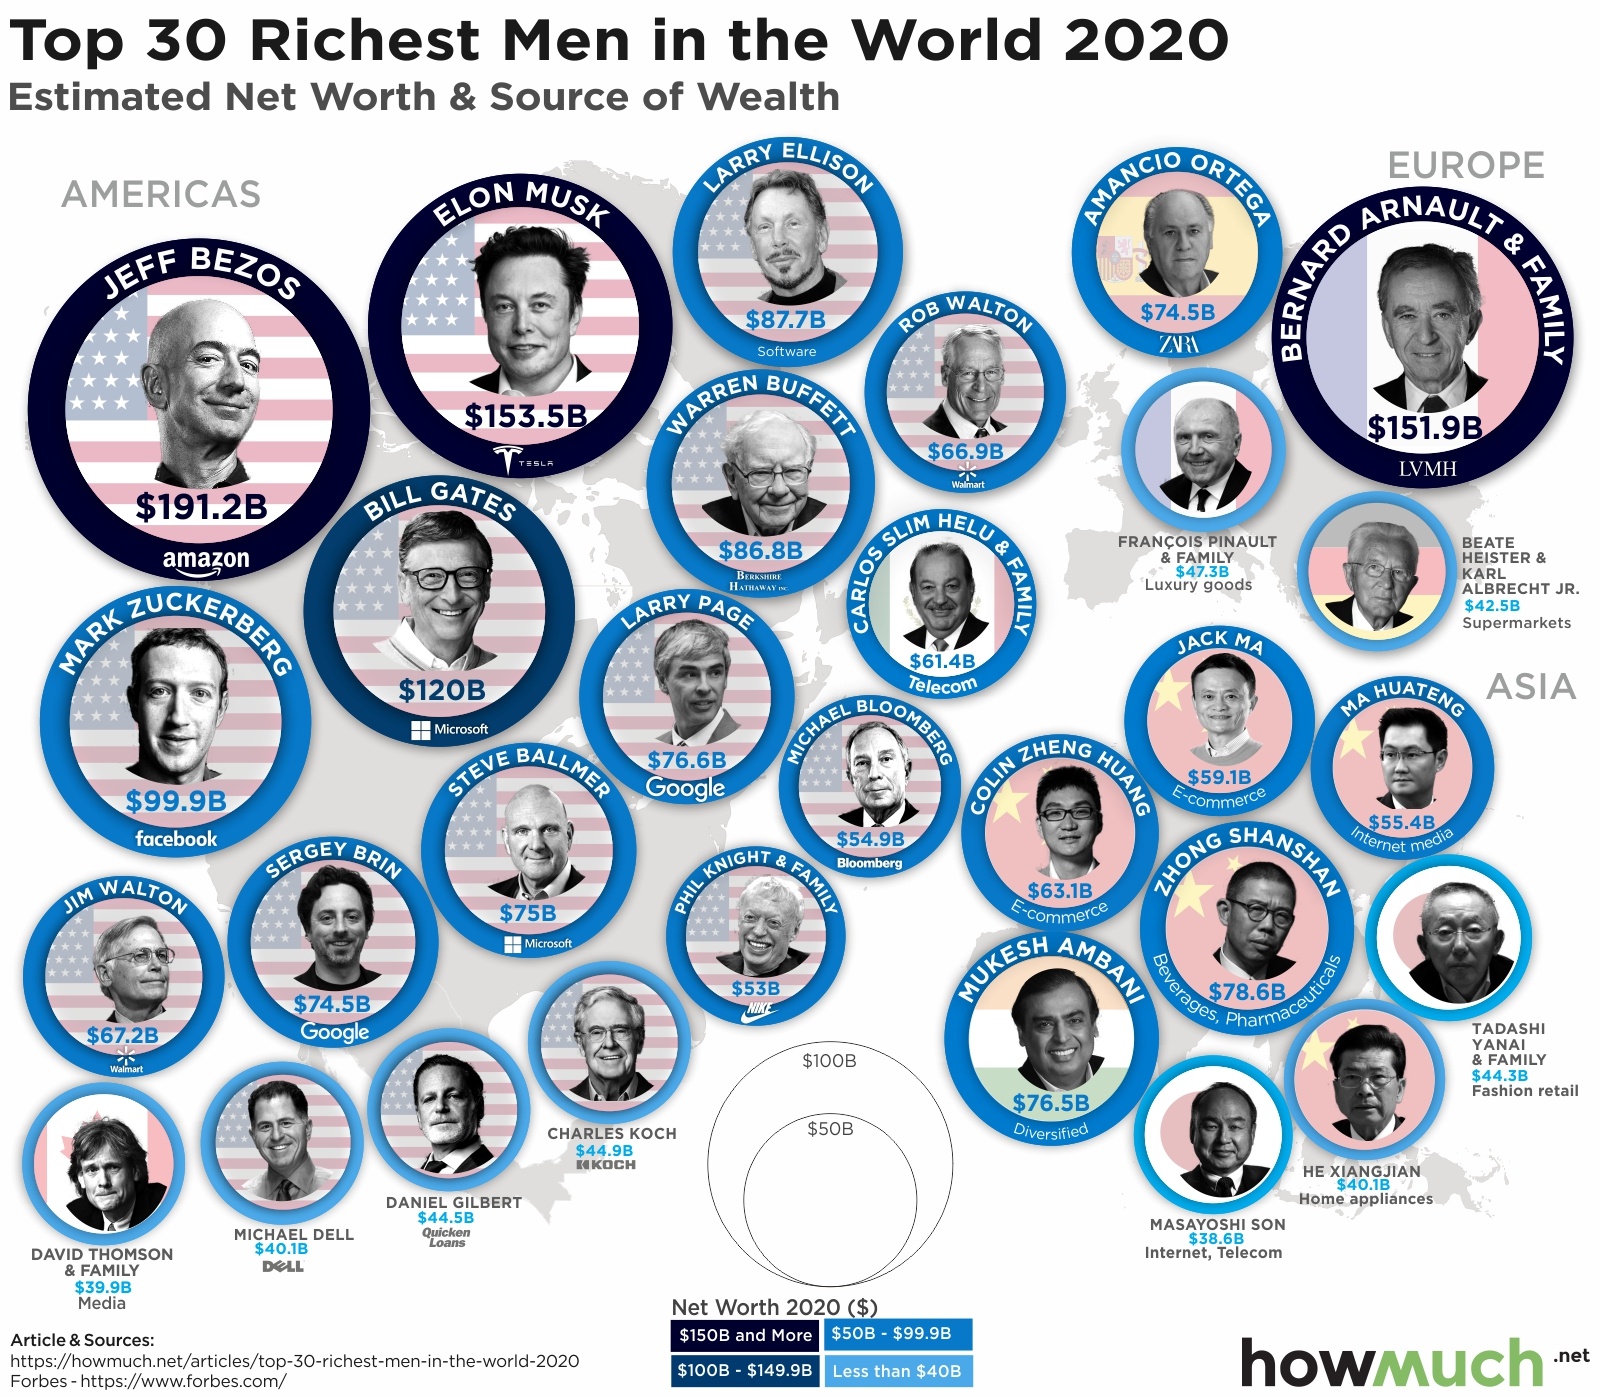
How much are the richest people in the world worth? This map stacks up the fortunes of the world’s 30 richest men

April 3rd, 2026
Personal Finance
business
The Economy
trade
Wealth
jobs
We pulled together our most popular visualizations of 2020 to let you know what's trending. Not surprisingly, economic issues and wealth landed at the top of our list

April 3rd, 2026
The Economy
jobs
This visualization shows employment changes by industry during the coronavirus pandemic.