
April 3rd, 2026
The Economy
jobs
This visual breaks down the occupations with the fastest growing job markets over the next decade
April 3rd, 2026
The Economy
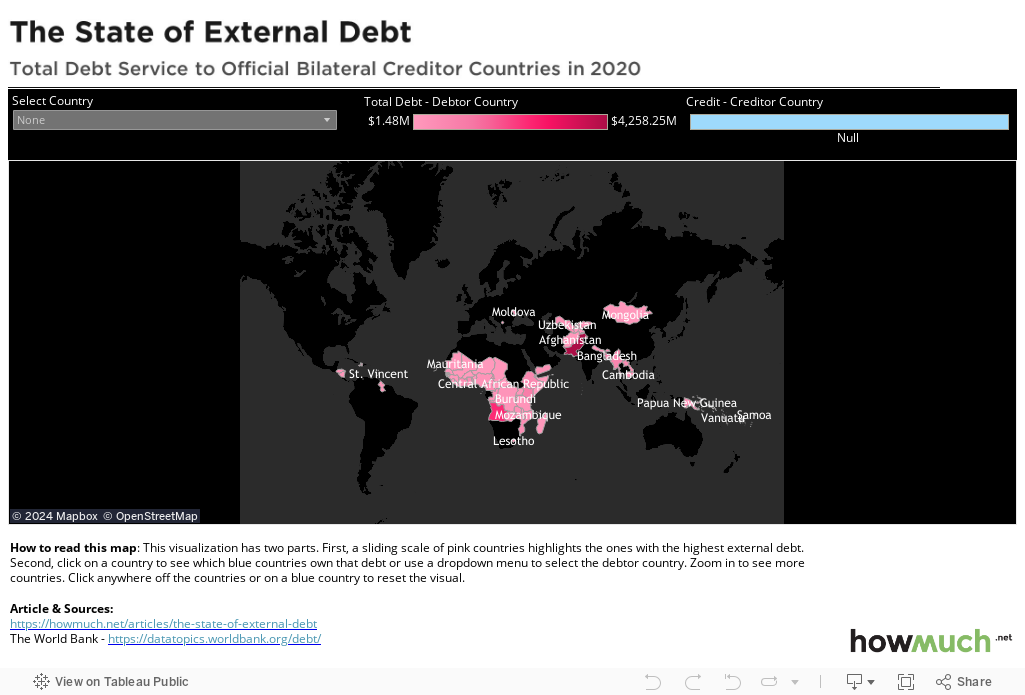
debt
This interactive visualization lets you explore which poor countries are taking on the most debt due to COVID-19, and their biggest creditors.

April 3rd, 2026
business
The Economy
taxes
The U.S. doesn’t have a competitive top corporate tax rate. These maps breakdown which countries charge companies the most, and which ones charge the least

April 3rd, 2026
Personal Finance
jobs

April 3rd, 2026
The Economy
taxes
Here’s how top capital gain tax rates could change under President Biden’s latest proposal

April 3rd, 2026
The Economy
debt
Here’s the best way to visualize which countries have the worst debt to GDP ratios in the world

April 3rd, 2026
investments
This article and visualization discuss the top 10 cheapest electric cars currently on the market in America and the distance each car can travel on only one charge
April 3rd, 2026
The Economy
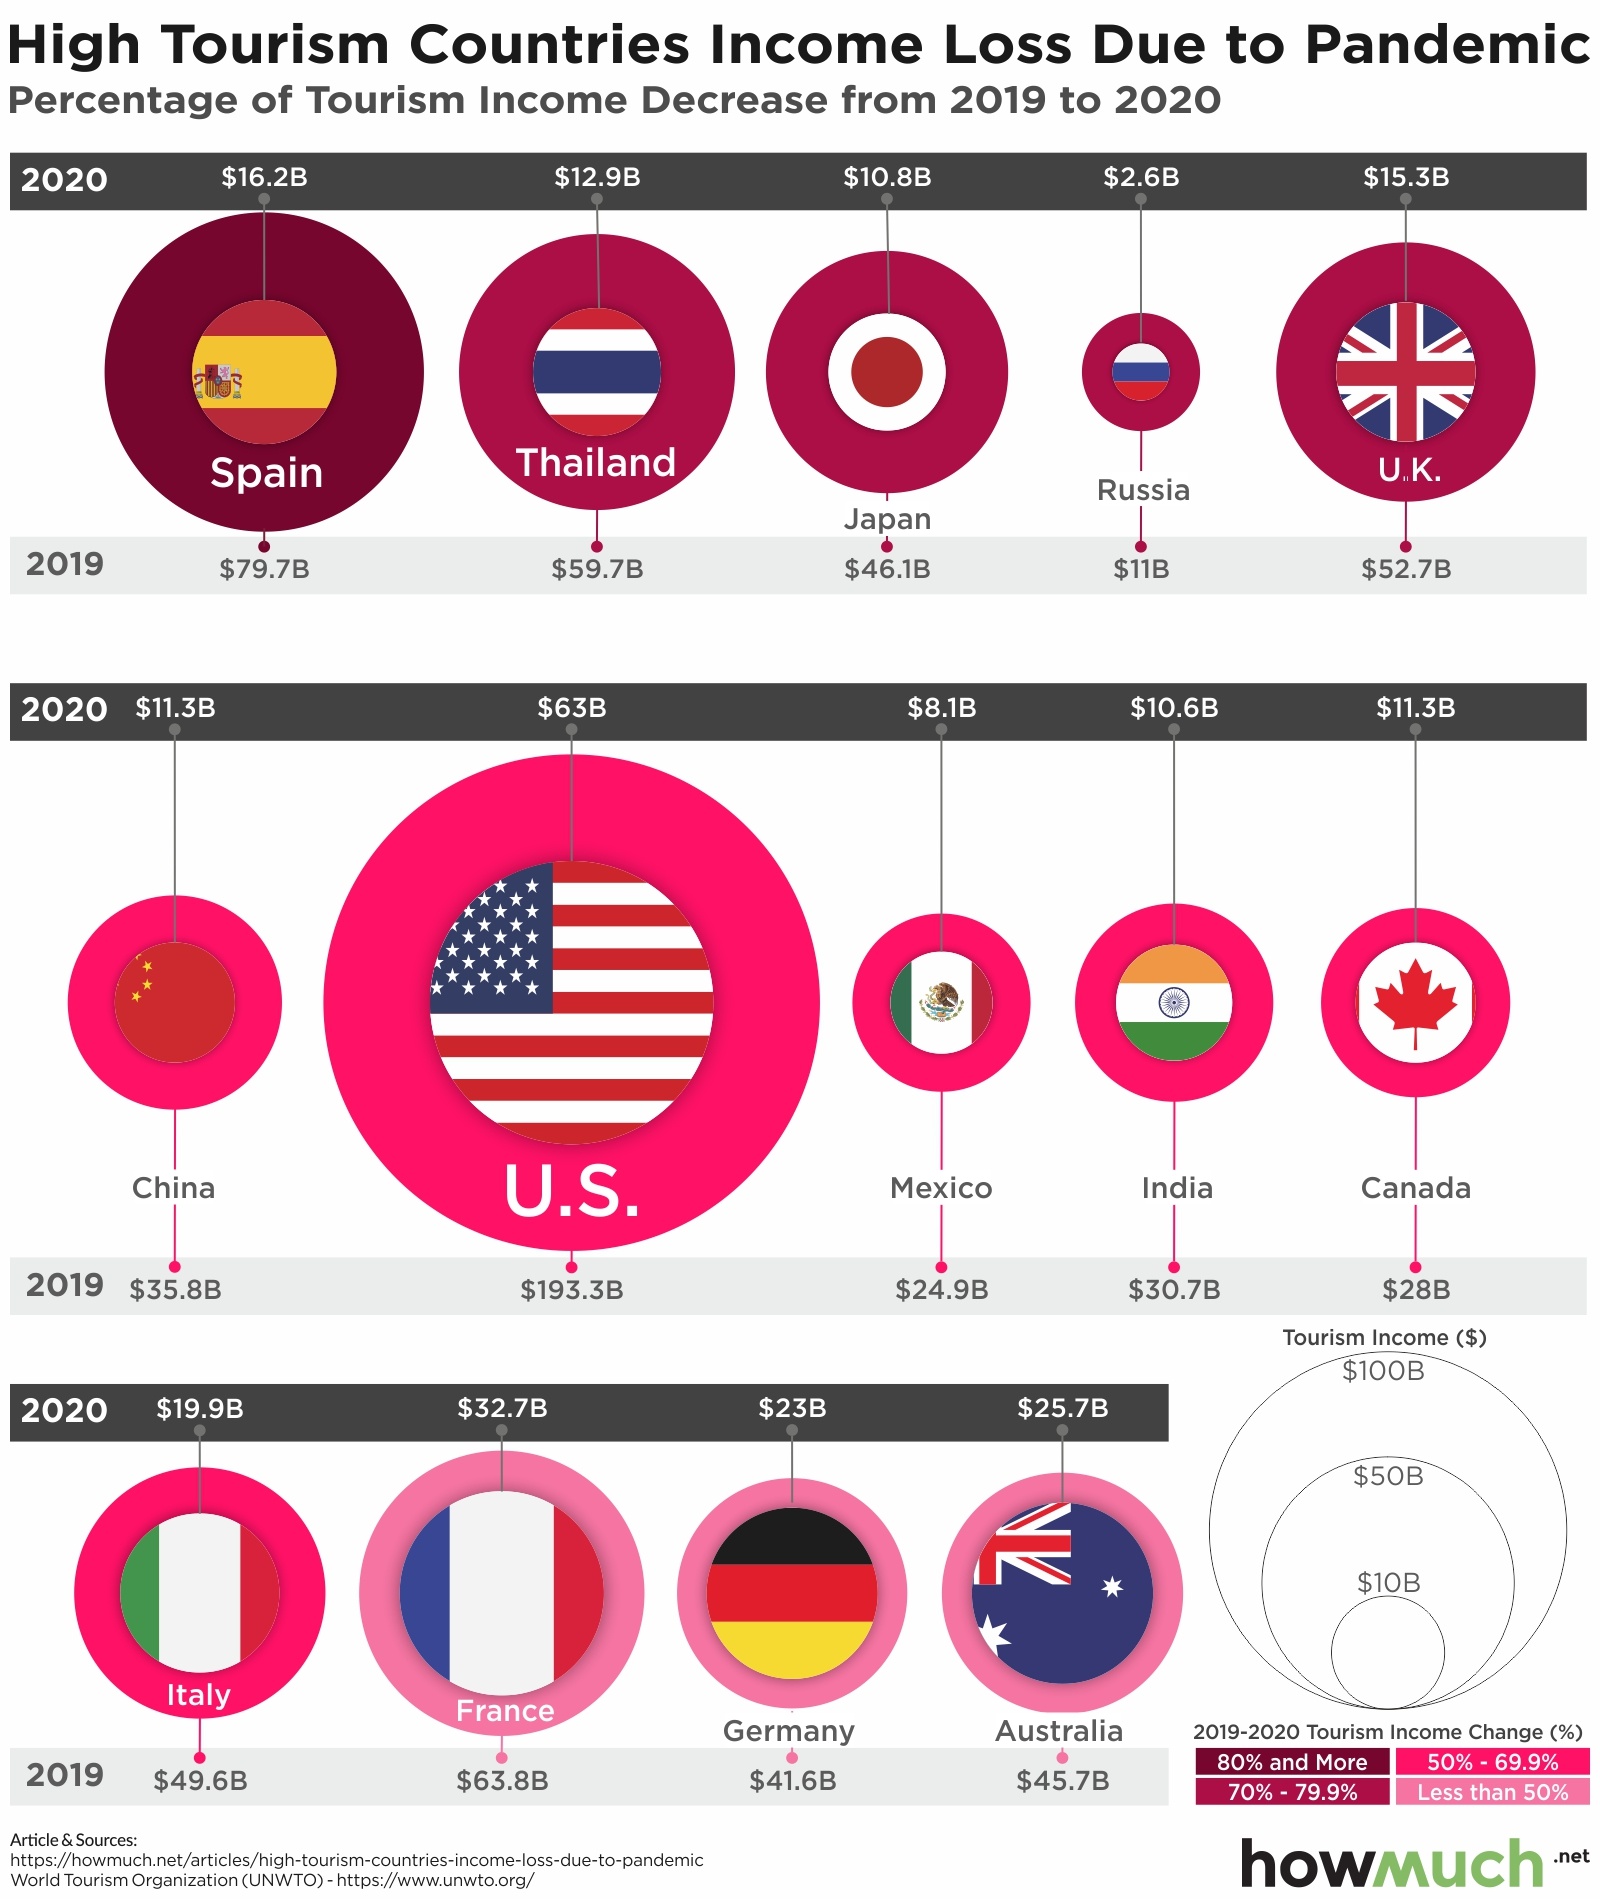
Here’s how to visualize the economic damage from COVID-19 on the global tourism industry

April 3rd, 2026
The Economy
This article and visualization illustrate total COVID-19 spending, categorized by agency, and provide agency spending figures (as of February 28, 2021) based on the total U.S. federal budgetary resources for FY 2021

April 3rd, 2026
The Economy
Here’s how Joe Biden’s American Jobs Plan is spending $2.65T of taxpayer money