September 23rd, 2025
The Economy
The coronavirus is scrambling the world economy. Here are the countries with the largest economies over the last 40 years

June 9th, 2021
Personal Finance
Business
The Economy
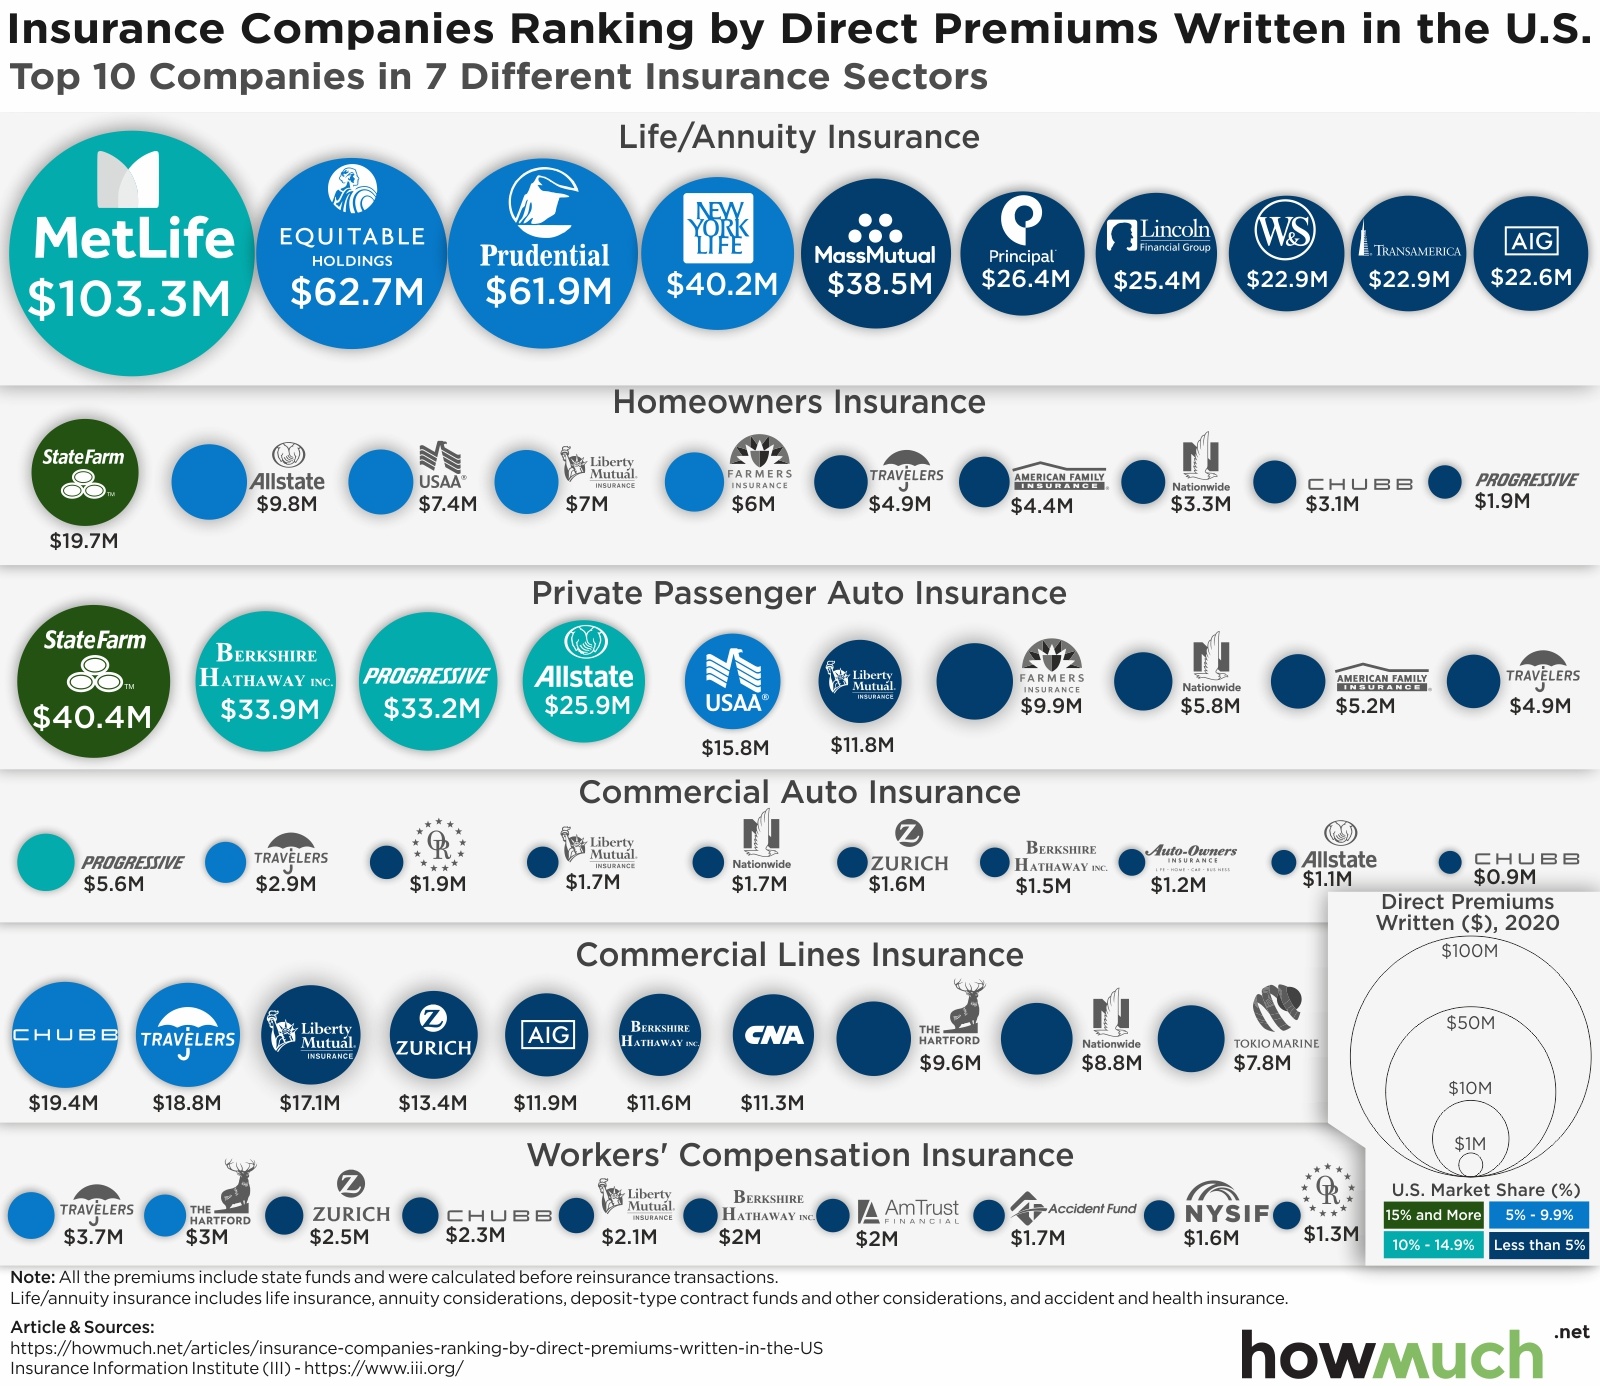
Insurance companies took in hundreds of millions last year in direct premiums. Here are the top 10 winners in each sector

June 4th, 2021
The Economy
Real Estate
This article and visualization discuss the fastest growing and declining rent prices for the top 10 cities across the United States, from April 2020 to April 2021

June 2nd, 2021
The Economy
Trade
China isn’t the top import partner for most states. Can you guess which country is?

May 24th, 2021
The Economy
Trade
The U.S. exports billions of dollars in goods around the world each year. This map highlights who the U.S. trades with the most.

May 17th, 2021
The Economy
Jobs
This visual breaks down the occupations with the fastest growing job markets over the next decade

May 14th, 2021
The Economy
Debt
This interactive visualization lets you explore which poor countries are taking on the most debt due to COVID-19, and their biggest creditors.

May 12th, 2021
Business
The Economy
Taxes
The U.S. doesn’t have a competitive top corporate tax rate. These maps breakdown which countries charge companies the most, and which ones charge the least

May 7th, 2021
The Economy
Taxes
Here’s how top capital gain tax rates could change under President Biden’s latest proposal

May 7th, 2021
The Economy
Debt
Here’s the best way to visualize which countries have the worst debt to GDP ratios in the world