Visualizing the Size of U.S. Stock Market When Compared to the Rest of the World
Stock markets bring wealth and woes to investors around the world. It’s hard to imagine anything more exciting and fearful. Icons like Warren Buffet made billions of dollars investing in corporate stocks. Yet, we all remember the collapse of the market a decade ago. Even with the global market whipping around, the U.S. still dominates the world stage. But where do all the rest come in?
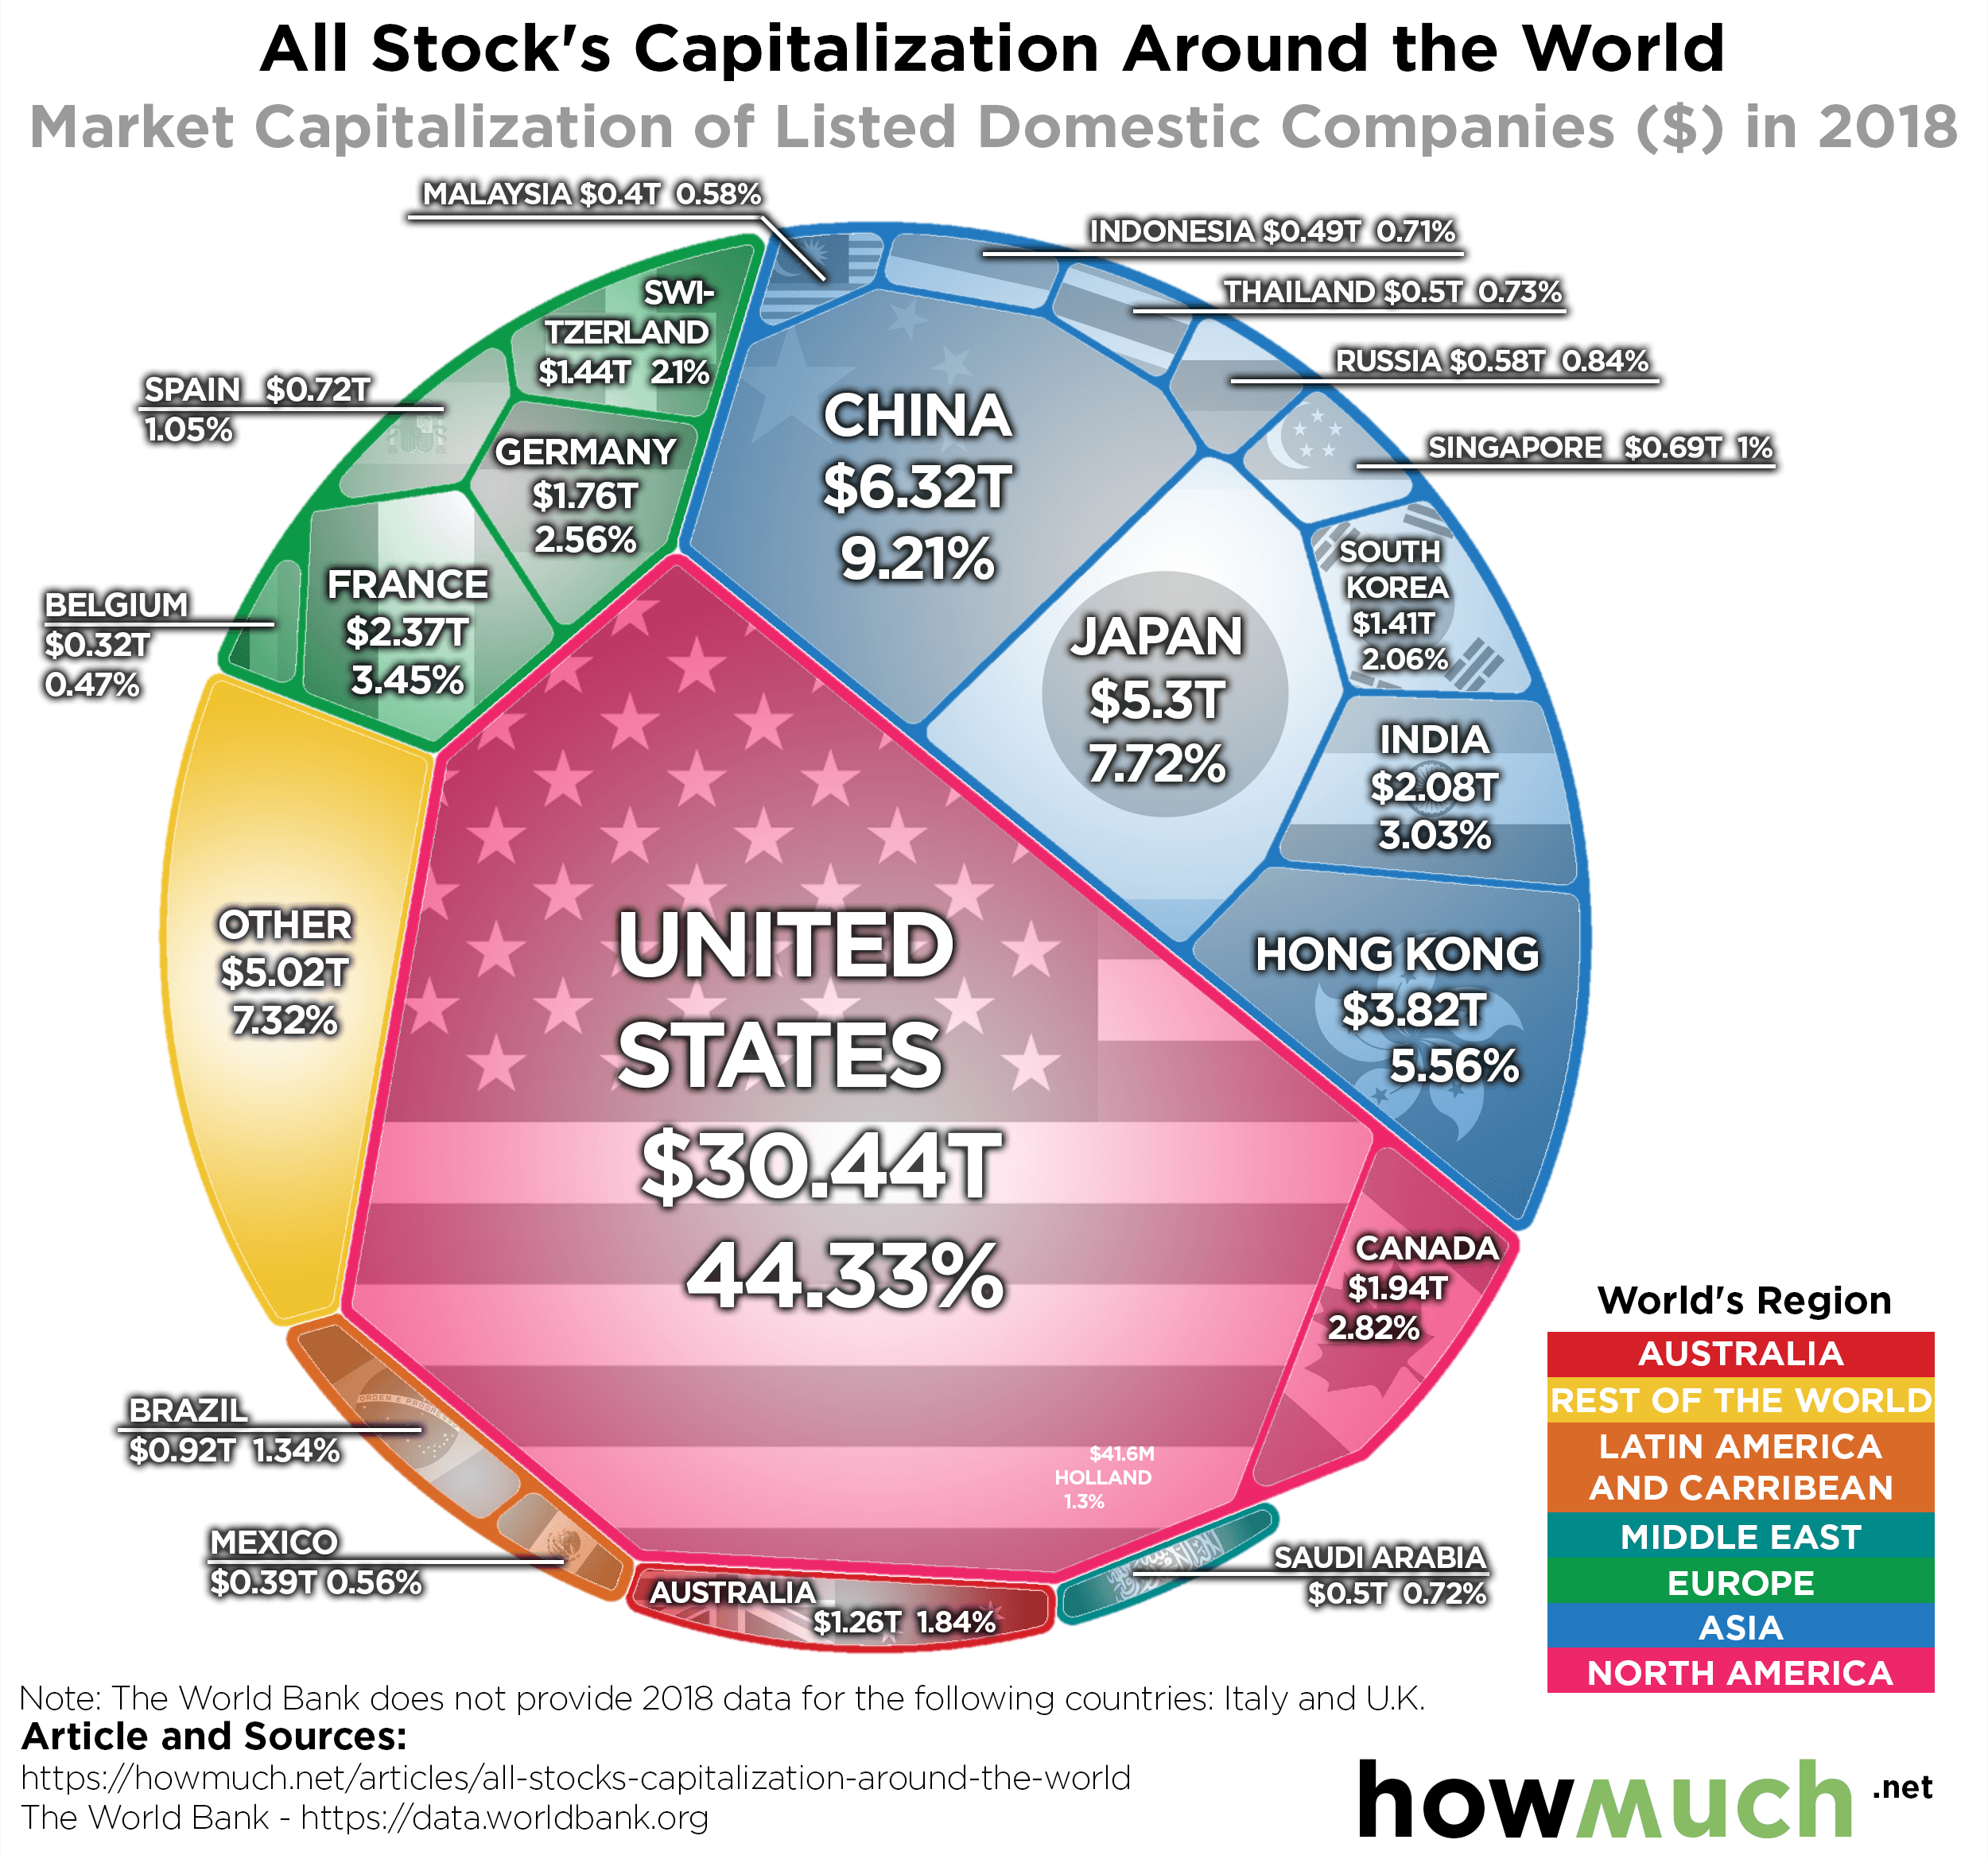
- The U.S. stock market is 5x the size of the closest competitor.
- In fact, the U.S. is so large it accounts for just under half of global equity value.
- China makes up the largest emerging stock market with $6.32 trillion.
- Hong Kong, being one city, matches half the equity value of China at $3.82 trillion.
- Small established economies like Switzerland have enormous markets relative to their population.
It’s worth noting the World Bank data does not include the U.K. and Italy. The London Stock Exchange’s estimated size is $4.7 trillion. The Italian markets are estimated at $0.65 trillion.
The global stock markets remain volatile as we enter a historically difficult month for equities. Investors worry the global trade war and continue to pile into bonds and gold for safety. Central banks continue to drive down interest rates to keep global growth alive.
Despite the massive changes in the global landscape, the major players remain the same. The U.S. accounts for nearly half of all the stock market value globally. The closest competitor, China, remains only 1/5th the value of the U.S.
So where do all the other countries we hear about stand? Our visualization lays out the equity value for each stock market by country.
Top 10 Stock Markets Around the Globe
1. United States - $30.44 trillion
2. China - $6.32 trillion
3. Japan – $5.3 trillion
4. Hong Kong - $3.82 trillion
5. France - $2.37 trillion
6. India - $2.08 trillion
7. Canada - $1.94 trillion
8. Germany - $1.76 trillion
9. Switzerland - $1.44 trillion
10. South Korea - $1.41 trillion
It’s astonishing that many established European markets only make up 1%-3% of the global stock market value. The U.S. domination of the global marketplace explains why the U.S. Federal Reserve remains the focus of investors around the globe. Despite this, many central banks around the world have embarked on historic rate cuts into negative yields.
Yet, given the size of the U.S. market, if it heads into a recession, how could it not impact the global markets? Trade wars with China add to uncertainty and have already hurt their global equity values. Their economy has been racked by the tariff escalations. But notice the potential regional powers that exist. Should the East Asian countries band together, they present a formidable presence against the United States.
One thing remains certain. Based on the visualization, we know that the U.S. stock market drives other markets. That creates leverage in the trade wars, as well as ties the global markets to the United States.
But what do you think? Does the graphic represent the stock market or does it speak to the global economic influence?