Median U.S. Home Prices and Housing Affordability by State
The coronavirus pandemic is reshaping the U.S. economy in a lot of different ways, especially the housing market. COVID-19 has sent office workers looking to move away from major cities and into the suburbs for more space, and historically low mortgage interest rates have added further fuel to an already hot market. But most households cannot comfortably afford to own a house, as our latest map of median U.S. home prices illustrates.
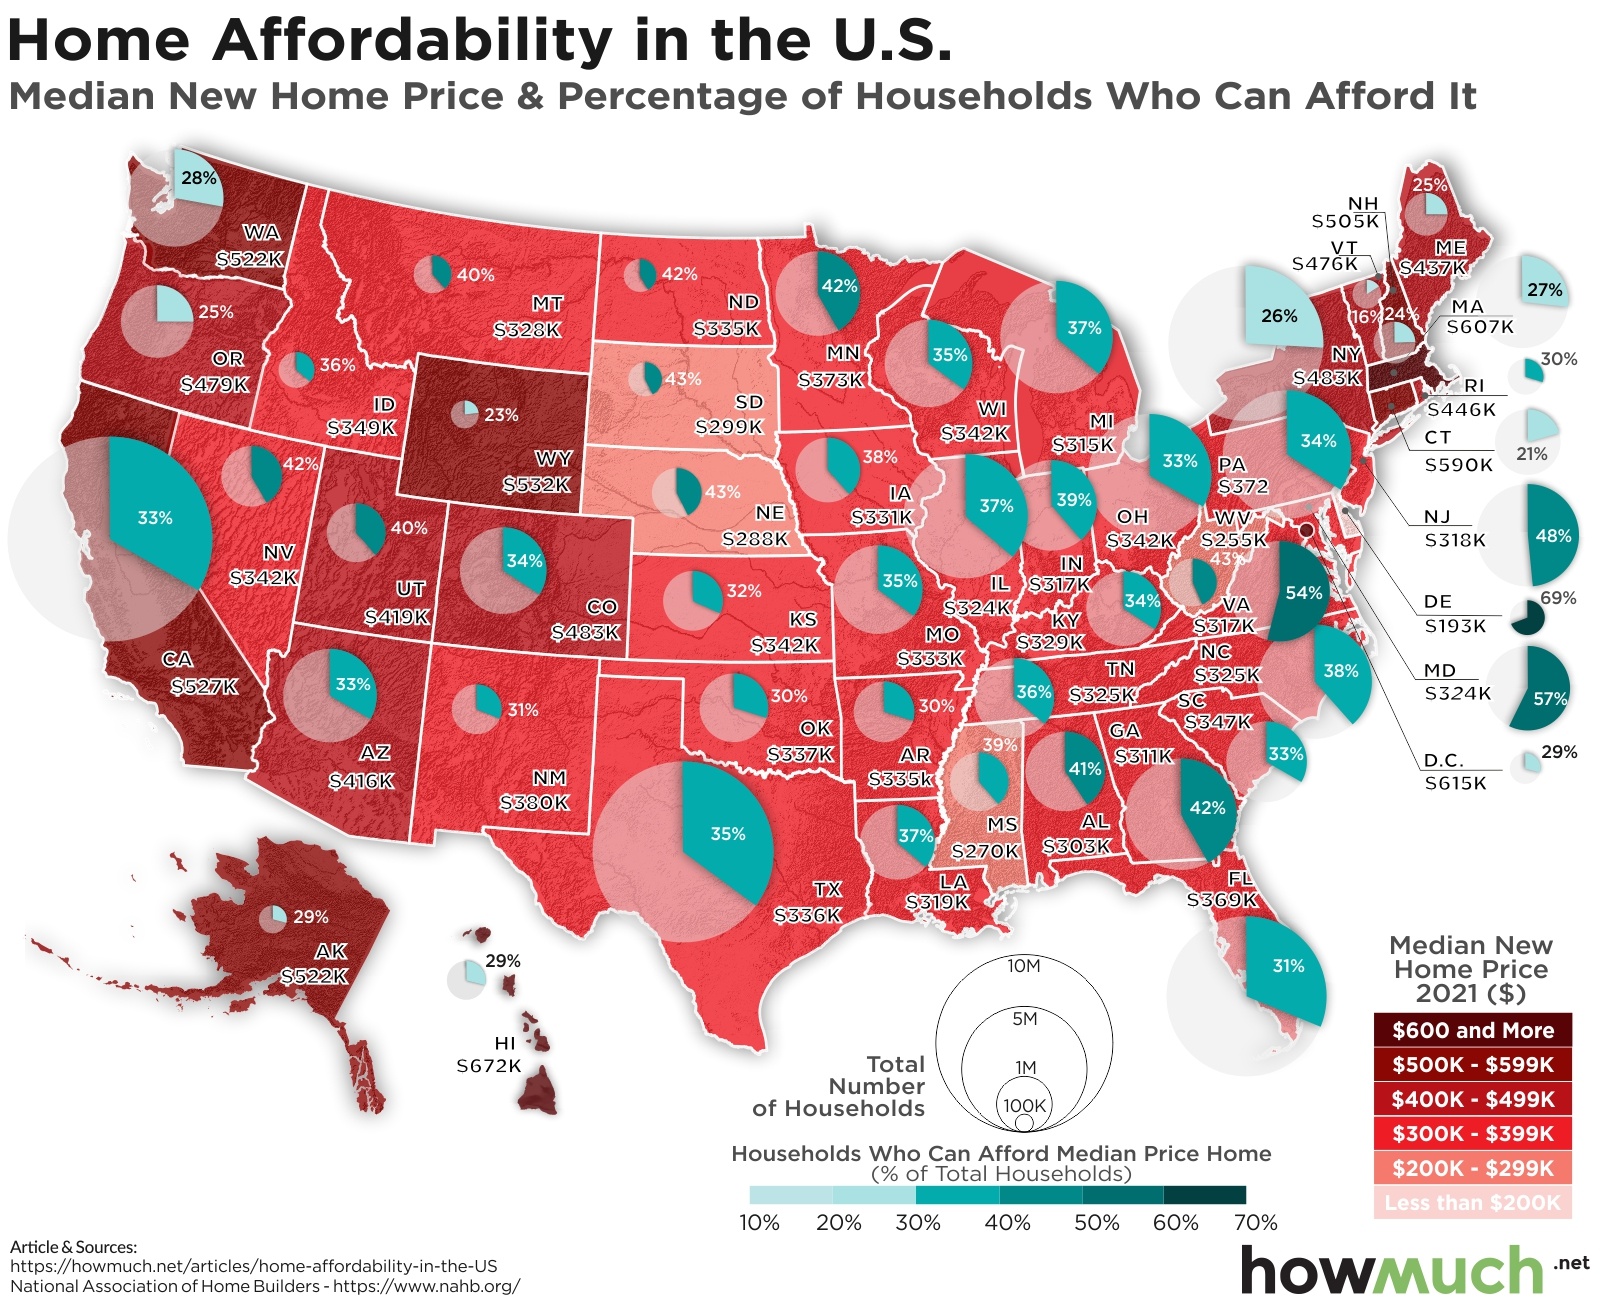
- Vermont is the least affordable state in the country, with only 16% of households able to easily afford a mortgage payment for a new median price home costing $476K.
- Not every state in the Northeast has a massive housing affordability problem. Delaware is the most affordable place in the entire country because some 69% of households can afford a home worth about $193K.
- Housing affordability is a real problem in largely rural states like Wyoming (23%) as well as states with large urban areas, like New York (26%).
- A close look at our map reveals how different income levels between states directly plays into the housing affordability crisis. The same proportion of households can afford a home in California as Arizona (33%), but the median new home price is vastly different ($527K vs. $416K, respectively).
First, we color-coded each state based on the median new home price according to an index from the National Association of Home Builders. Second, we overlaid a circle representing how many households live in each state. And finally, we shaded a slice of each circle to indicate what percentage of households can afford a home. The result of our analysis is a detailed snapshot of the U.S. housing crisis from coast to coast.
Top 10 States Where the Least (%) of Households Can Afford a New Home
| State | Percentage of Households Who Can Afford the Median Price New Home |
|---|---|
| 1. Vermont | 16% |
| 2. Connecticut | 21% |
| 3. Wyoming | 23% |
| 4. New Hampshire | 24% |
| 5. Maine | 25% |
| 6. Oregon | 25% |
| 7. New York | 26% |
| 8. Massachusetts | 27% |
| 9. Washington | 28% |
| 10. Washington, DC | 29% |
In one broad stroke, our map uses a housing affordability index to illustrate the crisis across the country. There are only 3 states where more than half of the households can afford a home, like Delaware (69%), Maryland (57%) and Virginia (54%). In the vast majority of places, hardly anyone is in a position to pay the mortgage on a typical single-family home. This means that in places like Vermont here only 16% of the population can afford to own a home, families are getting financially stretched thin. This is true in states with huge cities like New York (26%) as well as largely rural states like Wyoming (23%). There’s no doubt mortgage payment forbearance is directly impacting lots of people’s lives.
But our map also tells a deeper story about housing prices. Interestingly, housing prices alone are not the sole determiner of affordability. If a lot of families have high enough incomes to support themselves, then an expensive housing market in itself doesn’t make homeownership impossible. Take California as an example, a state notorious for exorbitant housing prices, where a new home costs $527K but 33% of households can afford it. Compare that to next door Arizona, where a comparable house costs significantly less at $416K and still only 33% of the households can afford it. This suggests that runaway housing prices aren’t the only contributor to the affordability crisis. Wages are an equally important factor to consider.
If you are on the market for a new home, or shopping around for a better loan rate, check out our mortgage cost guide today.